Thành viên V&S Group
HỌC VIỆN GIAO DỊCH FOREX
Multiple time frame analysis is simply the process of looking at the same pair and the same price, but on different time frames. Remember, a pair exists on several time frames – the daily, the hourly, the 15-minute, heck, even the 1-minute! This means that different forex traders can have their different opinions on how a pair is trading and both can be completely correct.
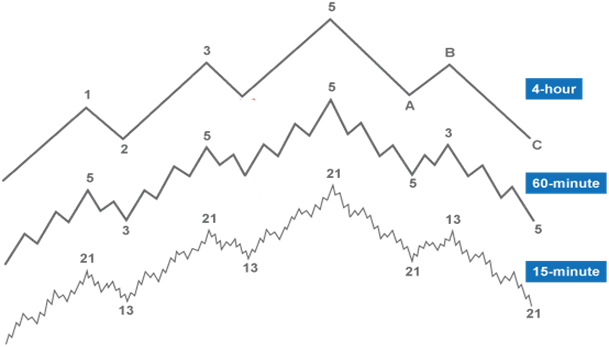
One may see that EUR/USD is on a downtrend on the 4-hour chart. As you can see, this poses a problem. Trades sometimes get confused when they look at the 4-hour, see that a sell signal, then they hop on the 1-hour and see price slowly moving up. Each forex trader should trade a specific time frame that fits his or her own personality. Finding the right time frame for your trading is not an easy task. A Forex trader faces a wide variety of choices when the trading career is started... and choosing the chart type and time frame configuration is one of them. Also, read the weekly trading strategy that will keep you sane. How to tackle it and what things should be considered? First, the time frame choice is connected to your trading style. Here is a list to provide an essential idea:
1. In case of a position trader - use higher time frames like a weekly chart
2. In case of a swing trader - use intermediate time frames like a 4-hour chart
3. In case of an intra-day trader - use lower time frames like a 15-minute chart
Multiple time frame offers the chance for traders to read what the big money is doing; instead of trying to follow someone on TV. It offers the possibility for traders to improve and enhance their strategy’s performance via better entries, exits, trade management, money management, etc.
New forex traders will want to get rich quick, so they’ll start trading small time frames like the 1-minute or 5-minute charts. For some forex traders, they feel most comfortable trading the 1-hour charts. This time frame is longer, but not too long, and trade signals are fewer, but not too few. Trading on this time frame helps give more time to analyze the market and not feel so rushed.
In the table below, we’ve highlighted the basic time frames and the differences between each.
|
TIME FRAME |
|
|
|
|
|
|
|
|
SHORT-TERM (SWING) |
|
|
|
|
|
|
|
You also have to consider the amount of capital you have to trade. Shorter time frames allow you to make better use of margin and have tighter stop losses. Larger time frames require bigger stops, thus a bigger account, so you can handle the market swings without facing a margin call.
Many traders use multiple time frame
analysis techniques. This can result in a most reliable forex strategy as
it offers the opportunity for traders to understand the market structure in a
much deeper and profound way than any single time frame analysis can do. It
offers the chance for traders to read what the big money is doing; instead of
trying to follow someone on TV.
It offers the possibility for traders to improve and enhance their strategy’s
performance via better entries, exits, trade management, money management, etc.
Let’s compare this with a single time frame strategy… the single one offers a
very limited view of the market and leaves traders often confused as to why
their setup is failing.
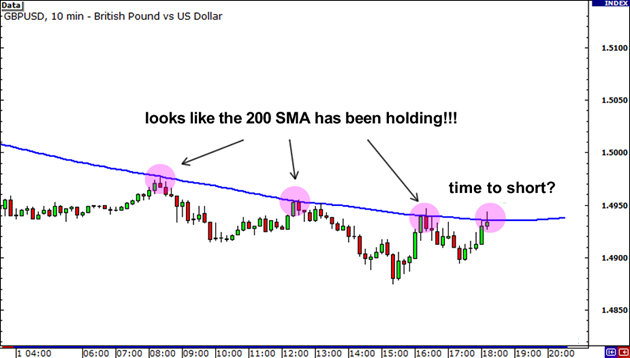
Let’s take a look at the 10-minute chart of GBP/USD at 8:00 am GMT. We’ve got the 200 simple moving average (SMA) on, which appears to be holding as resistance.
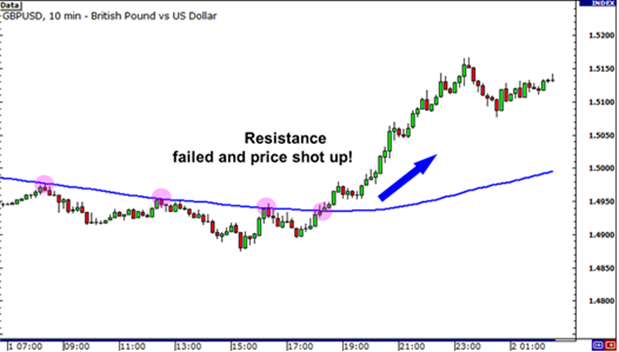
Contrary to the expectations, the pair closed above resistance and rose another 200 pips!
If you had been looking at the one hour chart, you would have noticed that the pair was actually at the bottom of the ascending channel. What’s more, a doji had formed right smack on the support line! A clear buy signal!
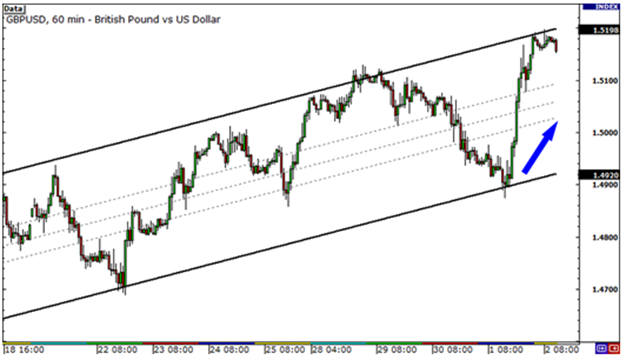
The ascending channel would have been even clearer on the 4-hour chart.
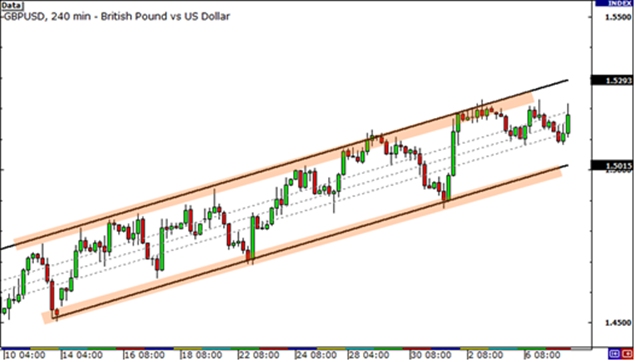
All of the charts were showing the same price data. They were just different time frames of that same data. When the market did stall or reverse on the 15-minute chart, it was often because it had hit support or resistance on a larger time frame. Trading using multiple time frames has probably kept us out of more losing trades than any other one thing alone.
Most traders seem to be able to grasp the importance of using the next higher timeframe to get a big picture view. But many of them seem to stop there and forget to zoom down to the next lower timeframe in order to optimize their entries.
As you may know or will soon come to realize, that in forex trading, in order to be consistently profitable, you must take advantage of every edge that is available. By ignoring optimal trade execution methods, you are leaving money on the table. So, to realize the best trade execution, you should zoom into the next lower timeframe than the one you were using and execute from there.
This is a crucial concept to understand. Most traders, on the other hand, typically take the opposite stance. They will chase a trade until they are filled regardless of how far price has moved away from their anticipated entry point.
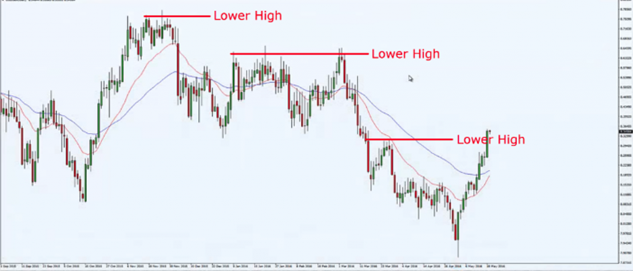
Now for the exits trades you could set a stop loss and target the very moment that you enter a trade. The price will either hit your stop for a small loss or hit your target for a nice profit. Sooner or later, you will realize that the moment that you are in a trade, all your biases will come into play and haunt you during your trade management. It is one of the most difficult aspects of trading, and each trader will have to work on an approach most suited to them. For example, you are looking at this chart below you'll note price that price is looking not too good. Maybe you'll say it's a long-term down trend because you have lower highs:
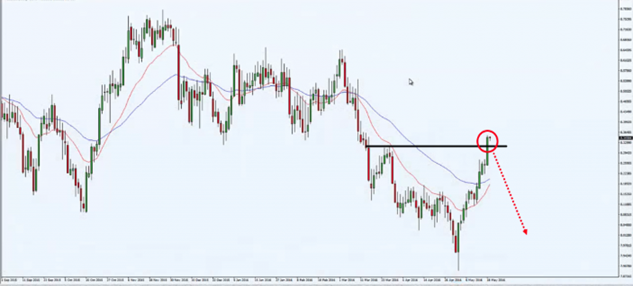
Or maybe the price just retested and swing high over here:
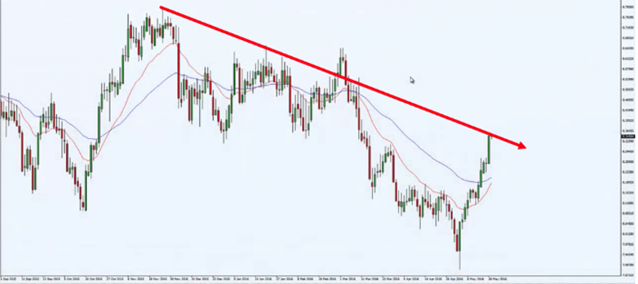
You're still not looking too good, because if we draw a long-term trend line...it's still pointing lower:
But when you go down to the lower timeframe or rather your entry timeframe, you see this:
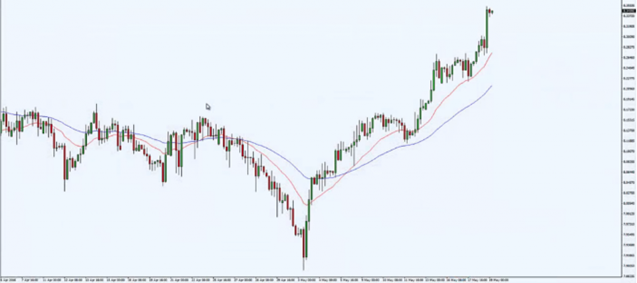
Price doesn't look bearish at all, it looks pretty bullish. Why is that? Because you want to trade with the current swing on the higher timeframe. The current swing on the higher timeframe is this portion over here:
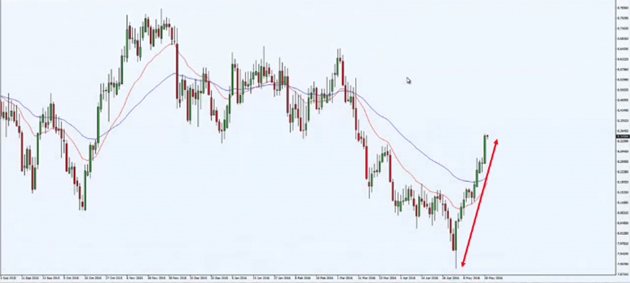
This is the portion that you want to focus on. It's bullish then on your lower timeframe, you want to be long. Imagine if you're looking to go short just because you saw that the higher timeframe is looking long-term bearish, and you're looking to go short on the lower timeframe. Chances are you're going to get stopped out repeatedly over time. Because you are going counter trend on your current timeframe. So, you want to focus on the current swing on the higher timeframe.
We feel that this gives us the most flexibility, as we can decipher the long, medium and short-term trends. What you'll think is, "Okay, maybe I should be looking to short."
The largest time frame we consider our main trend – this shows us the big picture of the pair we want to trade. For example, on the daily chart below, EUR/USD is trading above the 200 SMA which tells you that the main trend is UP.
The next time frame down is what we normally look at, and it signals to us the medium term buy or selling bias. Below is a 4-hour chart and it’s clear that EUR/USD continues to have a bullish bias.
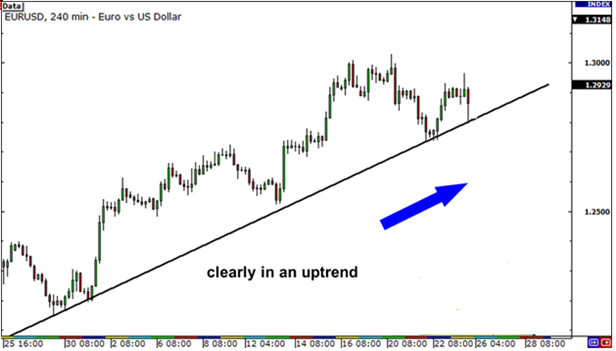
The smallest time frame shows the short term trend and helps us find really good entry and exit points.
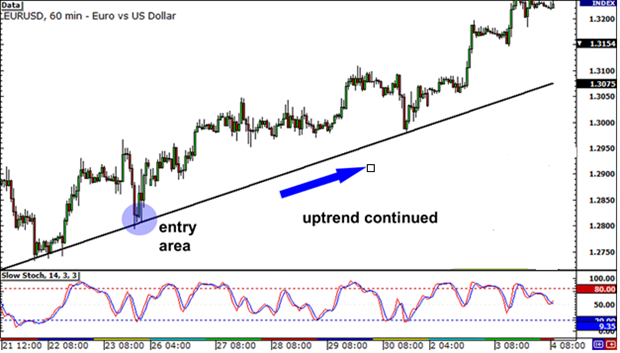
You can use any time frame you like as long as there is enough time difference between them to see a difference in their movement. You might use:
a) 1-minute, 5-minute, and 30-minute
b) 5-minute, 30-minute, and 4-hour
c) 15-minute, 1-hour, and 4-hour
d) 1-hour, 4-hour, and daily
e) 4-hour, daily, and weekly and so on.
When you’re trying to decide how much time in between charts, just make sure there is enough difference for the smaller time frame to move back and forth without every move reflecting in the larger time frame.
*The information presented above is intended for informative and educational purposes, should not be considered as investment advice, or an offer or solicitation for a transaction in any financial instrument and thus should not be treated as such. Past performance is not a reliable indicator of future results.

Hội chợ đầu tư Cairo 2021
Giải thưởng Siêu FinTech 2022
Fintech Châu Âu 2022
Giải thưởng Forex toàn cầu năm 2023
Hội chợ đầu tư Cairo 2021
Giải thưởng Siêu FinTech 2022
Fintech Châu Âu 2022
Giải thưởng Forex toàn cầu năm 2023
Bản quyền © 2024 - Đã đăng ký bản quyền.
Soho Markets LLC được thành lập tại St. Vincent & Grenadines với giấy phép số 1310 LLC 2021, cung cấp dịch vụ Giao dịch Toàn cầu.
Cảnh báo Rủi ro: CFD là công cụ giao dịch phức tạp và có nguy cơ mất tiền nhanh chóng do đòn bẩy. Bạn nên xem xét liệu bạn có hiểu cách thức hoạt động của thị trường CFD hay chưa và liệu bạn có khả năng chấp nhận rủi ro thua lỗ. Vui lòng đọc toàn bộ Cảnh báo Rủi ro.
Khu vực hạn chế: SOHO MARKETS GLOBAL LIMITED không cung cấp dịch vụ tại lãnh thổ trực thuộc Hoa Kỳ, Canada, Israel, Nhật, Triều Tiên, Bỉ và khu vực bị UN/EU trừng phạt.
Soho Markets Global Limited và Soho Markets LLC không cung cấp dịch vụ cho khách hàng khu vực Liên minh EU. Khách hàng tại khu vực EU sẽ chỉ có thể sử dụng dịch vụ của Vstar & Soho Markets Ltd.
THỎA THUẬN KHÁCH HÀNG (ĐIỀU KHOẢN VÀ ĐIỀU KIỆN) Chính sách Quyền riêng tư Cảnh báo rủi ro