
Nạp Rút Siêu Nhanh


HỌC VIỆN GIAO DỊCH FOREX
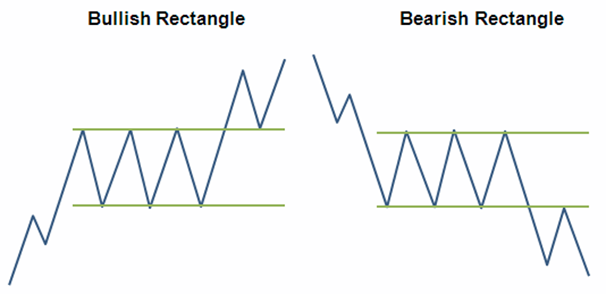
The rectangle is a familiar geometric form that most people study in grade school, but in technical price analysis, it can take on a special significance. For technical analysts, rectangles are normally understood as patterns that indicate the continuation of a price trend. The rectangle may be identified by other names, such as a trading range, a line, or a congestion pattern.
A rectangle occurs in a period of consolidation, when the market lacks conviction about either a strong price move upward or downward. Like other continuation patterns, the rectangle is formed by a series of two or more successive highs or lows that are roughly the same size. When these appear, traders can draw a line across the tops of the highs to indicate a level of resistance and across the lows to indicate a level of support.
A bearish rectangle is formed when the price consolidates for a while during a downtrend. Is a continuation pattern that occurs when a price pauses during a strong downtrend and temporarily bounces between two parallel levels before the trend continues.
After a pretty big fall, the market consolidates before determining where to go next. Obviously, they figure it out, and heads off in the direction they started in (down.) Volume kind of thins out during this sideways period and then picks up as it heads for the bottom of the rectangle one last time and breaks through it.
One way to trade a bearish rectangle is as soon as a candlestick has closed below the support level, enter your trade with a short (sell) order. Place your stop loss just above the resistance level and measure the height of the rectangle and then place your profit target the same distance underneath the rectangle's lower parallel line.
Here’s another example of a rectangle, this time, a bullish rectangle chart pattern.
Rectangle pattern in an uptrend. The market goes into roughly a three-week consolidation before it finds its resolve and pushes higher. There is a general lessening and sort of balance to volume during the formation, but there is a clear increase on the breakout. (It's interesting to note that the volume seems erratic prior to the consolidation, kind of balanced during, and while still generally balanced as the market moves away from the rectangle, noticeably heavier.)
Just like in the bearish rectangle pattern example, once the pair breaks, it will usually make a move that’s AT LEAST the size of its previous range.
One way to trade a bearish rectangle is as soon as a candlestick has closed above the resistance level, enter your trade with a long (buy) order. Place your stop loss just underneath the support level and measure the height of the rectangle and then place your profit target the same distance above the top of its upper parallel line.
The price action on any financial product is split into bullish and bearish sentiments. Effectively, the two words signal a bullish and bearish market.
The names come from the animal world. The horns of a bull always point to the upside, hence showing a rising market. As such, bullish means the market is on the rise, and traders look to buy dips in the bullish environment, to profit from higher prices to come.
On the other hand, bearish comes from the bear that walks with its head pointing to the ground. Or, to the south, meaning lower prices or a bearish market is in place. Hence, bearish and bullish markets refer to the price action of securities when it moves to the downside or to the upside. Also, when bulls attack they hit upward and when bears attack they hit you down.
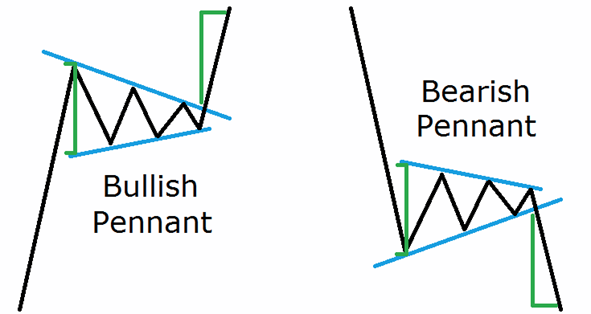
A pennant is a triangular formation that forms in the middle of bullish and bearish phases in any currency pair or another market. The price builds energy to break higher or lower, and it takes a bit of a time until it explodes in the direction of the underlying trend.
Bullish and bearish pennants/flag patterns belong to the classic technical analysis patterns. All such patterns have a measured move, or the distance the price must travel to confirm the pattern.
If the price doesn’t reach the measured move, the patterns is simply invalidated. That’s the beauty of technical analysis: it leaves no room for error when interpreting bullish and bearish patterns.
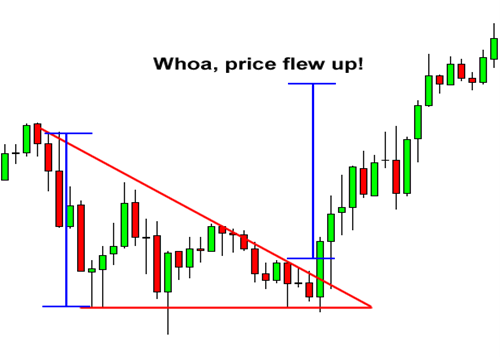
Bearish pennants are continuation patterns that mark a pause in the movement of a price halfway through a strong downtrend, offering you an opportunity to go short.
They occur just after a sharp drop in price and resemble a triangular flag as the price moves sideways, making gradually lower highs and higher lows. The downtrend then continues with another similar-sized fall in price.
Unlike the other chart patterns wherein the size of the next move is approximately the height of the formation, pennants signal much stronger moves.
Usually, the height of the earlier move (also known as the mast) is used to estimate the size of the breakout move.
In order to trade a bearish pennant, enter your short trade as soon as a candlestick has closed below the pennant's lower trend line, Place your stop loss on the other side of the pennant, just above its upper trend line. Measure the initial drop in price (the pennant's pole) before the market started to consolidate.
Then place your profit target the same distance below the pennant's breakout point.
A bullish pennant is the exact opposite of a bearish penant.
It is a continuation pattern that marks a pause in the movement of a price halfway through a strong uptrend, giving you an opportunity to go long and profit from the rest of the price rise.
Bullish pennants occur just after a sharp rise in price and resemble a triangular flag as the price moves sideways, making gradually lower highs and higher lows. The uptrend then continues with another similar-sized rise in price.
In order to trade a bullish pennant, enter your long trade as soon as a candlestick has closed above the pennant's upper trend line, place your stop loss on the other side of the pennant, just below its lower trend line. Measure the initial rise in price (the pennant's pole) before the market started to consolidate.
Then place your profit target the same distance above the pennant's breakout point.
A symmetrical triangle is a chart formation where the slope of the price’s highs and the slope of the price’s lows converge together to a point where it looks like a triangle.
What’s happening during this formation is that the market is making lower highs and higher lows. This means that neither the buyers nor the sellers are pushing the price far enough to make a clear trend.
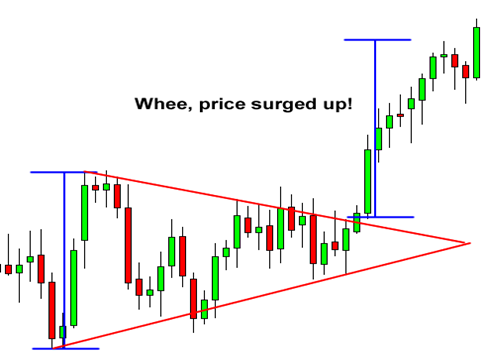
In the chart above, we can see that neither the buyers nor the sellers could push the price in their direction. As these two slopes get closer to each other, it means that a breakout is getting near.
We don’t know what direction the breakout will be, but we do know that the market will most likely break out. Eventually, one side of the market will give in.
We can place entry orders above the slope of the lower highs and below the slope of the higher lows. Since we already know that the price is going to break out, we can just hitch a ride in whatever direction the market moves. In this example, if we placed an entry order above the slope of the lower highs, we would’ve been taken along for a nice ride up. If you had placed another entry order below the slope of the higher lows, then you would cancel it as soon as the first order was hit.
This type of triangle chart pattern occurs when there is a resistance level and a slope of higher lows.
What happens during this time is that there is a certain level that the buyers cannot seem to exceed. However, they are gradually starting to push the price up as evident by the higher lows.
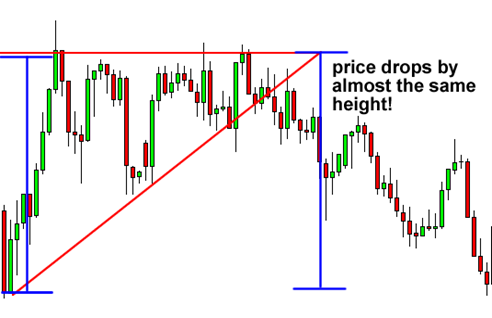
In the chart above, you can see that the buyers are starting to gain strength because they are making higher lows. They keep putting pressure on that resistance level and as a result, a breakout is bound to happen. In this case, we would set an entry order above the resistance line and below the slope of the higher lows. If we set our short order below the bottom of the triangle, we could’ve caught some pips off that dive.
As you probably guessed, descending triangles are the exact opposite of ascending triangles. In descending triangle chart patterns, there is a string of lower highs which forms the upper line. The lower line is a support level in which the price cannot seem to break.
In the chart above, you can see that the price is gradually making lower highs which tell us that the sellers are starting to gain some ground against the buyers.
In this case, we would place entry orders above the upper line (the lower highs) and below the support line. In this case, the price ended up breaking above the top of the triangle pattern.
After the upside breakout, it proceeded to surge higher, by around the same vertical distance as the height of the triangle. Placing an entry order above the top of the triangle and going for a target as high as the height of the formation would’ve yielded nice profits.
Below is a small summary to help you remember all those forex chart patterns and what they are signaling.
|
CHART PATTERN |
FORMS DURING |
TYPE OF SIGNAL |
NEXT MOVE |
|
Double Top |
Uptrend |
Reversal |
Down |
|
Double Bottom |
Downtrend |
Reversal |
Up |
|
Head and Shoulders |
Uptrend |
Reversal |
Down |
|
Inverse Head and Shoulders |
Downtrend |
Reversal |
Up |
|
Rising Wedge |
Downtrend |
Continuation |
Down |
|
Rising Wedge |
Uptrend |
Reversal |
Down |
|
Falling Wedge |
Uptrend |
Continuation |
Up |
|
Falling Wedge |
Downtrend |
Reversal |
Up |
|
Bearish Rectangle |
Downtrend |
Continuation |
Down |
|
Bullish Rectangle |
Uptrend |
Continuation |
Up |
|
Bearish Pennant |
Downtrend |
Continuation |
Down |
|
Bullish Pennant |
Uptrend |
Continuation |
Up |
*The information presented above is intended for informative and educational purposes, should not be considered as investment advice, or an offer or solicitation for a transaction in any financial instrument and thus should not be treated as such. Past performance is not a reliable indicator of future results.

Hội chợ đầu tư Cairo 2021
Giải thưởng Siêu FinTech 2022
Fintech Châu Âu 2022
Giải thưởng Forex toàn cầu năm 2023
Hội chợ đầu tư Cairo 2021
Giải thưởng Siêu FinTech 2022
Fintech Châu Âu 2022
Giải thưởng Forex toàn cầu năm 2023
Bản quyền © 2024 - Đã đăng ký bản quyền.
Soho Markets LLC được thành lập tại St. Vincent & Grenadines với giấy phép số 1310 LLC 2021, cung cấp dịch vụ Giao dịch Toàn cầu.
Cảnh báo Rủi ro: CFD là công cụ giao dịch phức tạp và có nguy cơ mất tiền nhanh chóng do đòn bẩy. Bạn nên xem xét liệu bạn có hiểu cách thức hoạt động của thị trường CFD hay chưa và liệu bạn có khả năng chấp nhận rủi ro thua lỗ. Vui lòng đọc toàn bộ Cảnh báo Rủi ro.
Khu vực hạn chế: SOHO MARKETS GLOBAL LIMITED không cung cấp dịch vụ tại lãnh thổ trực thuộc Hoa Kỳ, Canada, Israel, Nhật, Triều Tiên, Bỉ và khu vực bị UN/EU trừng phạt.
Soho Markets Global Limited và Soho Markets LLC không cung cấp dịch vụ cho khách hàng khu vực Liên minh EU. Khách hàng tại khu vực EU sẽ chỉ có thể sử dụng dịch vụ của Vstar & Soho Markets Ltd.
THỎA THUẬN KHÁCH HÀNG (ĐIỀU KHOẢN VÀ ĐIỀU KIỆN) Chính sách Quyền riêng tư Cảnh báo rủi ro