Part of V&S Group
-
TRADING
TRADING PLATFORM
Account type
Margin requirements
- TRADE RESOURCES
- INSTITUTIONAL SERVICE
- ABOUT
The U.S. dollar index (USDX) is a measure of the value of the U.S. dollar relative to the value of a basket of currencies of the majority of the U.S.'s most significant trading partners. This index is similar to other trade-weighted indexes, which also use the exchange rates from the same major currencies.
The U.S. dollar index allows traders to monitor the value of the USD compared to a basket of select currencies in a single transaction. It also allows them to hedge their bets against any risks with respect to the dollar. The index is currently calculated by factoring in the exchange rates of six major world currencies, which include the euro, Japanese yen, Canadian dollar, British pound, Swedish krona and Swiss franc. The euro holds the most weight versus the dollar in the index, constituting about 58 percent of the weighting followed by the yen with about 14 percent.
The U.S. Dollar Index (USDX, DXY, DX) is an index (or measure) of the value of the United States dollar relative to a basket of foreign currencies, often referred to as a basket of U.S. trade partners' currencies. The Index goes up when the U.S. dollar gains "strength" (value) when compared to other currencies.
The index is maintained and published by ICE (Intercontinental Exchange, Inc.), with the name "U.S. Dollar Index" a registered trademark. It is a weighted geometric mean of the dollar's value relative to following select currencies:
1. Euro (EUR), 57.6% weight
2. Japanese yen (JPY) 13.6% weight
3. Pound sterling (GBP), 11.9% weight
4. Canadian dollar (CAD), 9.1% weight
5. Swedish krona (SEK), 4.2% weight
6. Swiss franc (CHF) 3.6% weight
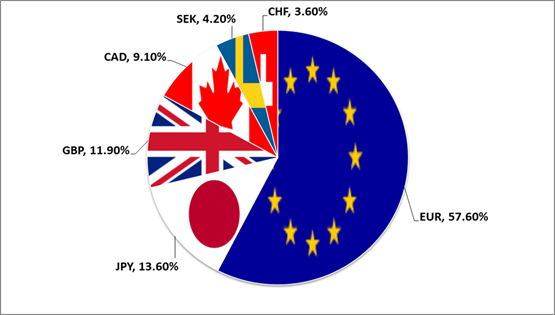
Just like any currency pair, the US Dollar Index (USDX) even has its own chart.
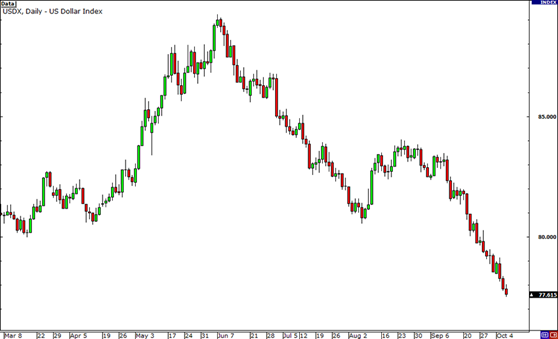
First, notice that the index is calculated 24 hours a day, five days a week. Also, the US Dollar Index (USDX) measures the dollar’s general value relative to a base of 100.000.
For example, the current reading says 86.212. This means that the dollar has fallen 13.79% since the start of the index. (86.212 – 100.000).
If the reading was 120.650, it means the dollar’s value has risen 20.65% since the start of the index. (120.650 – 100.000)
USDX = 50.14348112 × EUR/USD^(-0.576) × USD/JPY^(0.136) × GBP/USD^(-0.119) × USD/CAD^(0.091) × USD/SEK^(0.042) × USD/CHF^(0.036)
There is also another kind of dollar index used by the Federal Reserve. It is called the “trade-weighted U.S. dollar index“.
The trade-weighted US dollar index, also known as the broad index, is a measure of the value of the United States dollar relative to other world currencies. It is a trade weighted index that improves on the older U.S. Dollar Index by using more currencies and the updating the weights yearly (rather than never). The base index value is 100 in Jan 1997.

From strongest to weakest, here is the current weighting (in percentage) of the index(as of February 12, 2017):
|
COUNTRY |
WEIGHT(%) |
COUNTRY |
WEIGHT(%) |
|
Eurozone |
17.056 |
Switzerland |
1.982 |
|
China |
21.892 |
Thailand |
1.447 |
|
Canada |
11.977 |
Australia |
1.157 |
|
Mexico |
12.6 |
Russia |
1.053 |
|
Japan |
6.281 |
Israel |
1.019 |
|
United Kingdom |
3.679 |
Sweden |
0.664 |
|
Korea |
3.994 |
Indonesia |
0.969 |
|
Taiwan |
2.317 |
Saudi Arabia |
0.791 |
|
Singapore |
1.694 |
Chile |
0.751 |
|
Brazil |
1.808 |
Philippines |
0.575 |
|
Malaysia |
1.59 |
Colombia |
0.582 |
|
Hong Kong |
1.378 |
Argentina |
0.503 |
|
India |
1.975 |
Venezuela |
0.258 |
|
Total |
100 |
The main difference between the USDX and the trade-weighted U.S. dollar index is the basket of currencies used and their relative weights. The trade-weighted index includes countries from all over the world, including some developing countries.
Given how global trade is developing, this index is probably a better reflection of the dollar’s value across the globe.
The U.S. Dollar Index (often marked as DXY or USDX) is widely used in Forex. The U.S. dollar index is an indicator of the U.S. currency's strength. It measures the value of the dollar relative to a basket of major currencies: Euro, Yen, Canadian Dollar, British Pound, Swedish Krona and the Swiss Franc. Target weights of index components are provided below: the euro (57.5%), the Japanese yen (13.6%), the British pound sterling (11.9%), the Canadian dollar (9.1%), the Swedish krona (4.2%) and Swiss franc (3.6%).
Taking into account that the dollar index is strongly shifted towards European currencies, it significantly lowers the share of the Canadian dollar. In addition, this index completely ignores the currencies of the Asia-Pacific region, including S. Korea, Australia, Taiwan and China.
The dollar index (DXY) was created by JP Morgan in 1973 and since that time it was updated only once when the several European currencies were subsumed by the euro.
The base value of the USDX index was 100.00. For example, 107.50 means that the value of the dollar increased by 7.5 percent, relative to the base value.
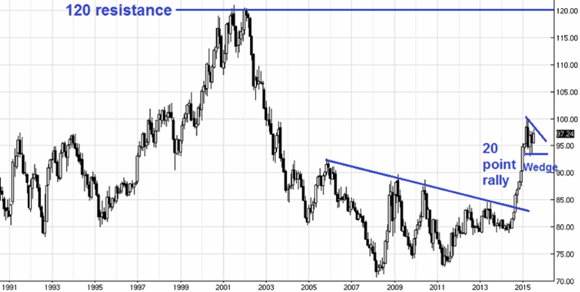
The dollar index can be used to analyze currency pairs in the forex market, just as stock market investors use stock indexes to determine the general direction of the trend in the market.
If you trade currency pairs which involve U.S. dollar, the dollar index will give an idea of the relative strength of the dollar to currency pairs such as EURUSD, GBPUSD, USDCHF. We can safely say that USDX has a correlation with the above-mentioned currency pairs and this indicator can be used by the trader as an additional indicator in the analysis of the market.
If the dollar is the base currency (the first in the currency pair), then the dollar index and the currency pair will go in one direction. If the dollar is a quoted currency, then the index and the currency chart will go in different directions. If DXY increases (that means that the dollar firms), then the EURUSD chart will move lower.
The dollar index is influenced by common factors that affect currencies, such as: fiscal and monetary factors, interest rates, inflation and foreign trade. That is why the analysis of the dollar index can help you for developing your own long-term trading strategy.
The theory is simple. It states that the dollar tends to outperform when the US economy is very strong (on the left side of the smile) or very weak (right side). And it does poorly when the US economy is just muddling through (middle of the smile).
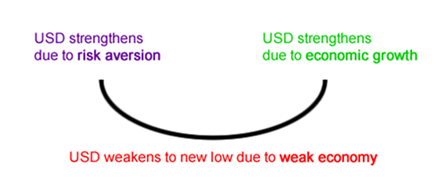
Scenario #1: USD Strengthens Due to Risk Aversion
The first part of the smile shows the U.S. dollar benefiting from risk aversion, which causes investors to flee to “safe-haven” currencies like the dollar and the yen. Since investors think that the global economic situation is shaky, they are hesitant to pursue risky assets and would rather buy up the less risky U.S. dollar regardless of the condition of the U.S. economy.
Scenario #2: USD Weakens to New Low Due to Weak Economy
Dollar drops to a new low. The bottom part of the smile reflects the lackluster performance of the Greenback as the U.S. economy grapples with weak fundamentals. The possibility of interest rate cuts also weighs the U.S. dollar down. This leads to the market shying away from the dollar.
Scenario #3: USD Strengthens Due to Economic Growth
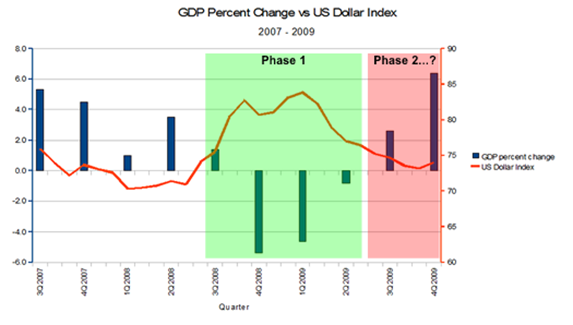
The dollar appreciates due to economic growth. In other words, the greenback begins to appreciate as the U.S. economy enjoys stronger GDP growth and expectations of interest rate hikes increase. This theory appears to have been in play when the 2007 financial crisis began:
The dollar got a huge boost at the peak of the global recession - That’s phase 1.
The market eventually bottomed out in March 2009, investors suddenly switched back to the higher yielding currencies - That’s phase 2.
*The information presented above is intended for informative and educational purposes, should not be considered as investment advice, or an offer or solicitation for a transaction in any financial instrument and thus should not be treated as such. Past performance is not a reliable indicator of future results.

Cairo Investment Expo 2021
Ultimate FinTech Awards 2022
European Fintech 2022
2023 Global Forex Awards
Cairo Investment Expo 2021
Ultimate FinTech Awards 2022
European Fintech 2022
2023 Global Forex Awards
Online Chat Chat with us
Email:supportsohomarkets.com
Copyright © 2024 - All rights reserved.
Soho Markets LLC is incorporated in St. Vincent & the Grenadines as an International Business Company with registration number 1310 LLC 2021.
Risk Warning: CFDs are complex instruments and come with a high risk of losing money rapidly due to leverage. You should consider whether you understand how CFDs work and whether you can afford to take the high risk of losing your money. Please read the full Risk Disclosure.
Regional Restrictions: SOHO MARKETS GLOBAL LIMITED does not provide services in the territories of the United States of America, Canada, Israel, Japan, North Korea, Belgium, and UN/EU Sanctioned countries.
Soho Markets Global Limited and Soho Markets LLC do not provide services to EU clients. EU clients can only be serviced by Vstar & Soho Markets Ltd.
CLIENT AGREEMENT (TERMS AND CONDITIONS) Privacy Policy Risk Disclosure