
DEPOSIT METHODS


FOREX TRADING ACADEMY
Chart formations will greatly help us spot conditions where the market is ready to break out.
They can also indicate whether the price will continue in its current direction or reverse.
1. Double Top and Double Bottom
2. Head and Shoulders and Inverse Head and Shoulders
3. Rising and Falling Wedges
4. Bullish and Bearish Rectangles
5. Bearish and Bullish Pennants
6. Triangles (Symmetrical, Ascending, and Descending)
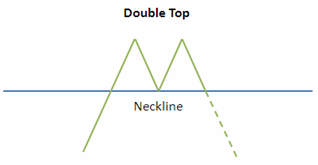
A double top is a reversal pattern that is formed after there is an extended move up.
The double top and bottom price pattern is one of the most popular reversal price patterns in technical analysis. It’s very popular among traders not only because it’s fairly simple but because it can be applied to all market segments and time intervals.
The double top price pattern is also known as pattern “M” due to its shape. It’s made up of two tops where the second top should not be higher than the first. A perfect “M” is where both tops are exactly on the same level - but these types of situations are not often found on the market, simply because the market does not form such a formation so rigidly.
This pattern is first formed when the market draws one top after which a corrective movement is initiated, followed by the forming of a second top. The bottom that is found between the two tops forms a significant support level.
When the support level is broken by the market, a sell signal is generated with a higher probability that the market will lose value. The breaking of the support level defines the entry level for the trader.
It’s worth remembering that the double top price pattern, unlike many other technical analysis tools, can also define a target. After the breakout of the support level, the market should decrease by a distance equal to the distance measured from the first top to the bottom found between the two tops (distance X in the example shown above).
After breaking the support, the market has a higher probability of decreasing by the distance counted from the first top to the support break itself.
The “tops” are peaks which are formed when the price hits a certain level that can’t be broken.
After hitting this level, the price will bounce off it slightly, but then return back to test the level again. If the price bounces off of that level again, then you have a DOUBLE top!
With the double top, we would place our entry order below the neckline because we are anticipating a reversal of the uptrend.

Looking at the chart you can see that the price breaks the neckline and makes a nice move down.
Remember that double tops are a trend reversal formation, so you’ll want to look for these after there is a strong uptrend.
You’ll also notice that the drop is approximately the same height as the double top formation.
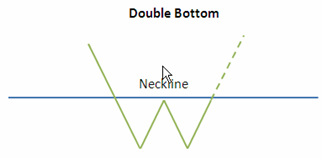
The double bottom is also a trend reversal formation, but this time we are looking to go long instead of short.
The double bottom price pattern is also known as pattern “W “due to its shape. It is made up of two bottoms where the second bottom should not be lower than the first.
This pattern is first formed when the market draws one bottom after which an increase movement is initiated, followed by the forming of a second bottom. The top that is found between the two bottoms forms a significant resistance level.
When the resistance level is broken by the market, a buy signal is generated with a higher probability that the market will gain in value. The breaking of the resistance level defines the entry level for the trader.
Similarly to the double top, the double bottom price pattern also defines a potential target. After the breakout of the resistance level the market should gain in value by a distance equal to the distance measured from the first bottom to the top found between the two bottoms (distance X in the example shown above).
Remember that risk management is a key factor in achieving success on the market when trading using technical analysis.
These formations occur after extended downtrends when two valleys or “bottoms” have been formed.
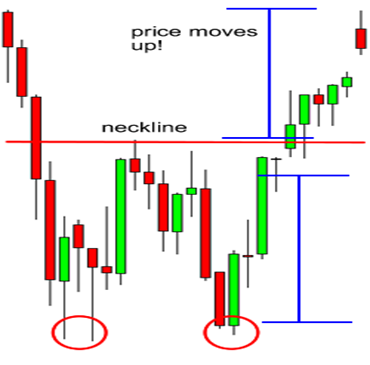
See how the price jumped by almost the same height as that of the double bottom formation?
Remember, just like double tops, double bottoms are also trend reversal formations.
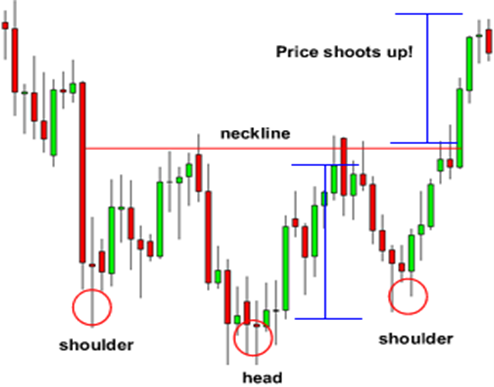
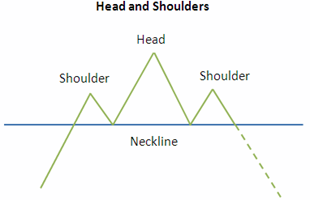
A head and shoulders pattern is a chart formation that resembles a baseline with three peaks, the outside two are close in height and the middle is highest. In technical analysis, a head and shoulders pattern describes a specific chart formation that predicts a bullish-to-bearish trend reversal. The head and shoulders pattern is believed to be one of the most reliable trend reversal patterns. It is one of several top patterns that signal, with varying degrees of accuracy, that an upward trend is nearing its end.
A head and shoulders pattern is also a trend reversal formation.
It is formed by a peak (shoulder), followed by a higher peak (head), and then another lower peak (shoulder). A “neckline” is drawn by connecting the lowest points of the two troughs.
The slope of this line can either be up or down. Typically, when the slope is down, it produces a more reliable signal.
The head is the second peak and is the highest point in the pattern. The two shoulders also form peaks but do not exceed the height of the head.
The head and shoulders pattern forms when a stock's price: Rises to a peak and subsequently declines back to the base of the prior up-move. Then, the price rises above the former peak to form the "nose" and then again declines back to the original base. Then finally, the stock price rises again, but to the level of the first, initial peak of the formation before declining back down to the base or neckline of chart patterns one more time.
The head and shoulders chart pattern is actually one of the hardest patterns for new traders to spot. However, with time and experience, this pattern can become an instrumental part of your trading arsenal.
Head and shoulders are known for generating false breakouts and creating perfect opportunities for fading breakouts. False breakouts are common with this pattern because many traders who have noticed this formation usually put their stop loss very near the neckline.
When the pattern experiences a false breakout, prices will usually rebound.
Traders who have sold the downside breakout or who have bought the upside breakout will have their stops triggered when prices move against their positions.
This usually is caused by the institutional traders who want to scrape money from the hands of individual traders.
In a head and shoulders pattern, you can assume that the first break tends to be false.
You can fade the breakout with a limit order back in the neckline and just put your stop above the high of the fake out candle.
You could place your target a little below the high of the second shoulder or a little above the low of the second shoulder of the inverse pattern.
With this formation, we put an entry order below the neckline.
We can also calculate a target by measuring the high point of the head to the neckline.
This distance is approximately how far the price will move after it breaks the neckline.
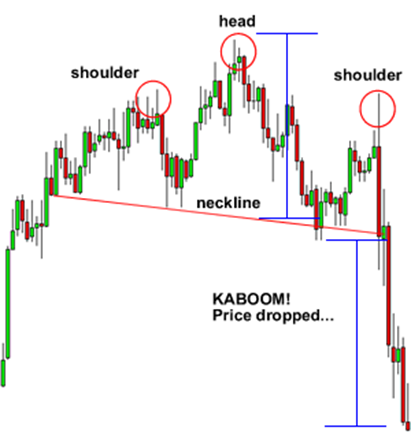
You can see that once the price goes below the neckline it makes a move that is at least the size of the distance between the head and the neckline.
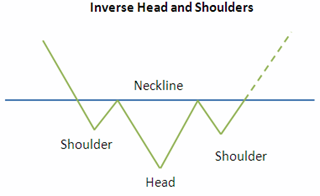
The name speaks for itself. It is basically a head and shoulders formation, except this time it’s upside down.
A valley is formed (shoulder), followed by an even lower valley (head), and then another higher valley (shoulder). These formations occur after extended downward movements.
With this formation, we would place a long entry order above the neckline.
Our target is calculated just like the head and shoulders pattern.
Measure the distance between the head and the neckline, and that is approximately the distance that the price will move after it breaks the neckline.
You can see that the price moved up nicely after it broke the neckline.
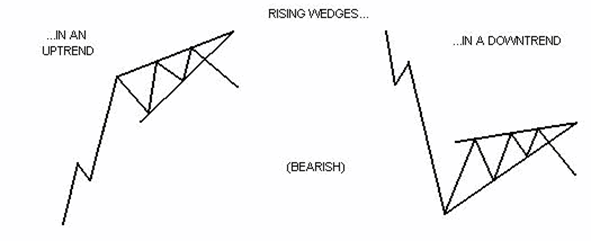
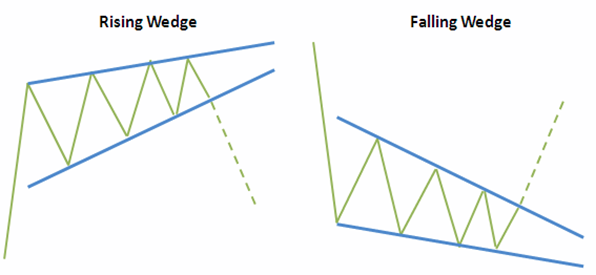
The wedge formation is also similar to a symmetrical triangle in appearance, in that they have converging trendlines that come together at an apex. However, wedges are distinguished by a noticeable slant, either to the upside or to the downside. (As with triangles, volume should diminish during its formation and increase on its resolve.)
A rising wedge is generally considered bearish and is usually found in downtrends. They can be found in uptrends too, but would still generally be regarded as bearish. Rising wedges put in a series of higher tops and higher bottoms.
This indicates that higher lows are being formed faster than higher highs. This leads to a wedge-like formation, which is exactly where the chart pattern gets its name from!
With prices consolidating, we know that a big splash is coming, so we can expect a breakout to either the top or bottom.
The trend lines drawn above and below the price chart pattern can converge to help a trader or analyst anticipate a breakout reversal. While price can out of either trend line, wedge patterns have a tendency to break in the opposite direction from the trend lines. Therefore, rising wedge patterns indicate the more likely potential of falling prices after a breakout of the lower trend line. Traders can make bearish trades after the breakout by selling the security short or using derivatives such as futures or options, depending on the security being charted. These trades would seek to profit on the potential that prices will fall.
Another example of a rising wedge formation is when the price breaks to the downside and the downtrend continues. Only this time it acts as a bearish continuation signal.
A rising wedge formed after an uptrend usually leads to a REVERSAL (downtrend) while a rising wedge formed during a downtrend typically results in a CONTINUATION (downtrend).
Simply put, a rising wedge leads to a downtrend, which means that it’s a bearish chart pattern!
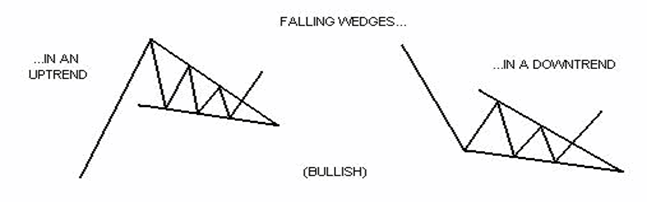
A falling wedge is generally considered bullish and is usually found in uptrends. But they can also be found in downtrends as well. The implication however is still generally bullish. This pattern is marked by a series of lower tops and lower bottoms.
Just like the rising wedge, the falling wedge can either be a reversal or continuation signal.
As a reversal signal, it is formed at a bottom of a downtrend, indicating that an uptrend would come next.
As a continuation signal, it is formed during an uptrend, implying that the upward price action would resume. Unlike the rising wedge, the falling wedge is a bullish chart pattern.
As a general rule price pattern strategies for trading systems rarely yield returns that outperform buy-and-hold strategies over time, but some patterns do appear to be useful in forecasting general price trends nonetheless. Some studies suggest that a wedge pattern will breakout towards a reversal (a bullish breakout for falling wedges and a bearish breakout for rising wedges) more often than two-thirds of the time, with a falling wedge being a more reliable indicator than a rising wedge.
Because wedge patterns converge to a smaller price channel, the distance between the price on entry of the trade and the price for a stop loss, is relatively smaller than the start of the pattern. This means that a stop loss can be placed close by at the time the trade begins, and if the trade is successful, the outcome can yield a greater return than the amount risked on the trade to begin with.
*The information presented above is intended for informative and educational purposes, should not be considered as investment advice, or an offer or solicitation for a transaction in any financial instrument and thus should not be treated as such. Past performance is not a reliable indicator of future results.

Cairo Investment Expo 2021
Ultimate FinTech Awards 2022
European Fintech 2022
2023 Global Forex Awards
Cairo Investment Expo 2021
Ultimate FinTech Awards 2022
European Fintech 2022
2023 Global Forex Awards
Online Chat Chat with us
Email:supportsohomarkets.com
Copyright © 2024 - All rights reserved.
Soho Markets LLC is incorporated in St. Vincent & the Grenadines as an International Business Company with registration number 1310 LLC 2021.
Risk Warning: CFDs are complex instruments and come with a high risk of losing money rapidly due to leverage. You should consider whether you understand how CFDs work and whether you can afford to take the high risk of losing your money. Please read the full Risk Disclosure.
Regional Restrictions: SOHO MARKETS GLOBAL LIMITED does not provide services in the territories of the United States of America, Canada, Israel, Japan, North Korea, Belgium, and UN/EU Sanctioned countries.
Soho Markets Global Limited and Soho Markets LLC do not provide services to EU clients. EU clients can only be serviced by Vstar & Soho Markets Ltd.
CLIENT AGREEMENT (TERMS AND CONDITIONS) Privacy Policy Risk Disclosure