
DEPOSIT METHODS


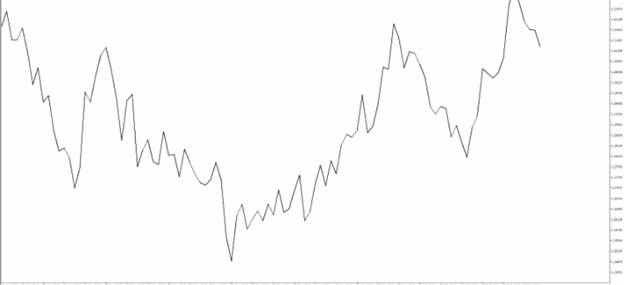
A line chart connects the closing prices of the timeframe you are viewing. So, when viewing a daily chart the line connects the closing price of each trading day. This is the most basic type of chart used by traders. It is mainly used to identify bigger picture trends but does not offer much else unlike some of the other chart types:
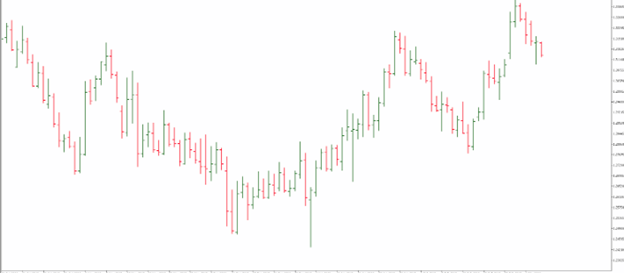
An OHLC bar chart shows a bar for each time period the trader is viewing. So, when looking at a daily chart, each vertical bar represents one day's worth of trading. The bar chart is unique as it offers much more than the line chart such as the open, high, low and close (OHLC) values of the bar.
The dash on the left represents the opening price and the dash on the right represents the closing price. The high of the bar is the highest price the market traded during the time period selected. The low of the bar is the lowest price the market traded during the time period selected.
2. The red bars are known as seller bars as the closing price is below the opening price.
In either case, the OHLC bar charts help traders identify who is in control of the market - buyers or sellers. These bars form the basis of the next chart type called candlestick charts which is the most popular type of forex charting:
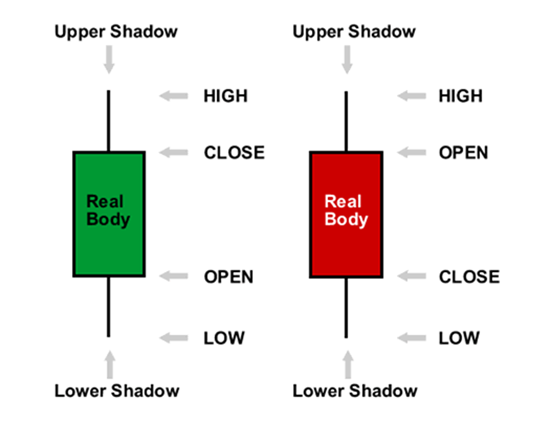
Candlestick charts were first used by Japanese rice traders in the 18th century. They are similar to OHLC bars in the fact they also give the open, high, low and close values of a specific time period. However, candlestick charts have a box between the open and close price values. This is also known as the 'body' of the candlestick.
Many traders find candlestick charts the most visually appealing when viewing live forex charts. They are also very popular as they provide a variety of price action patterns used by traders all over the world.
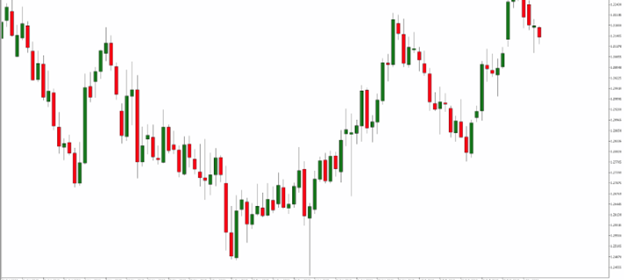
1. Candlesticks are easy to interpret, and are a good place for beginners to start figuring out forex chart analysis.
2. Candlesticks are easy to use! Your eyes adapt almost immediately to the information in the bar notation.
3. Candlesticks are good at identifying market turning points – reversals from an uptrend to a downtrend or a downtrend to an uptrend.
*The information presented above is intended for informative and educational purposes, should not be considered as investment advice, or an offer or solicitation for a transaction in any financial instrument and thus should not be treated as such. Past performance is not a reliable indicator of future results.

Cairo Investment Expo 2021
Ultimate FinTech Awards 2022
European Fintech 2022
2023 Global Forex Awards
Cairo Investment Expo 2021
Ultimate FinTech Awards 2022
European Fintech 2022
2023 Global Forex Awards
Online Chat Chat with us
Email:supportsohomarkets.com
Copyright © 2024 - All rights reserved.
Soho Markets LLC is incorporated in St. Vincent & the Grenadines as an International Business Company with registration number 1310 LLC 2021.
Risk Warning: CFDs are complex instruments and come with a high risk of losing money rapidly due to leverage. You should consider whether you understand how CFDs work and whether you can afford to take the high risk of losing your money. Please read the full Risk Disclosure.
Regional Restrictions: SOHO MARKETS GLOBAL LIMITED does not provide services in the territories of the United States of America, Canada, Israel, Japan, North Korea, Belgium, and UN/EU Sanctioned countries.
Soho Markets Global Limited and Soho Markets LLC do not provide services to EU clients. EU clients can only be serviced by Vstar & Soho Markets Ltd.
CLIENT AGREEMENT (TERMS AND CONDITIONS) Privacy Policy Risk Disclosure