ส่วนหนึ่งของวีแอนด์เอส กรุ๊ป
-
การซื้อขาย
แพลตฟอร์มการซื้อขาย
ประเภทบัญชี
ข้อกำหนดมาร์จิ้น
- ทรัพยากรการค้า
- บริการของสถาบัน
- เกี่ยวกับ
สถาบันการซื้อขายฟอเร็กซ์
Gold is one of the most traded commodities in the world due to its good intrinsic value and because is less affected by uncertain conditions. It affects three major currencies. i.e, USD, AUD and CHF. Gold, AUD and CHF have a strong positive relation. But never agree when related with USD. A rise in the dollar usually leads to fall in gold. To invest in gold or buy gold you have to first exchange your currency into US dollars. When the price of the dollar increases, it makes it expensive to buy gold leading to a fall in its demand which may further leads to a fall in gold prices per ounce.

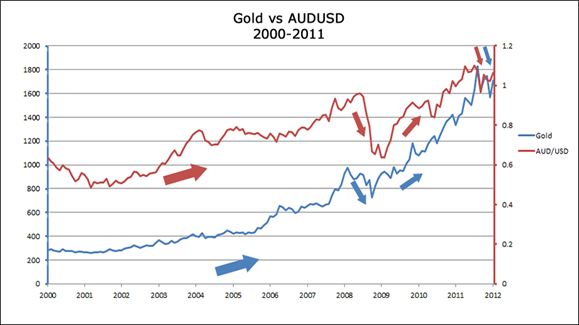
Gold and AUD have a positive relationship and are both inversely related to USD.
Australia being one of the major exporters of Gold in the world contributing about 80% of Gold to the market, its economy is highly boosted by gold. If prices of gold rise, the Australian exports will rise leading to expansion of the Australian economy and foreign investment. More of the Australian dollar will be demanded. When gold prices go up, AUDUSD will trend upwards due to the increased demand for AUD while when the gold prices fall the AUDUSD will trend down.
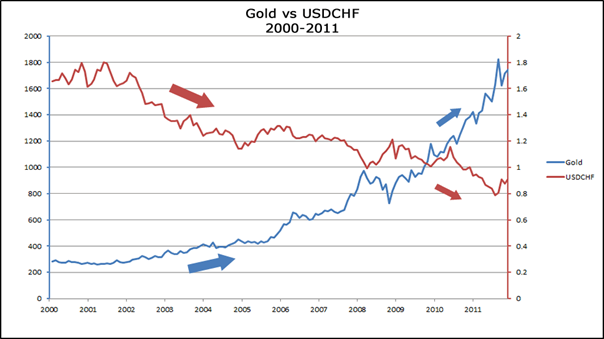
The Switzerland currency CHF has a positive correlation with gold. As prices of gold increase, the CHF also increases and vice versa. This is so because more than 25% of its currency is backed up by gold reserves. They are also both known to be inflation hedging (safe haven) in times of uncertainty.
Gold is positively related to CHF and inversely related to USDCHF. When the gold prices go up the USDCHF fall down indicating a sell off of the pair and vice versa.
All commodities are priced in US Dollars, and consequently, there is a negative correlation between the US Dollar and Commodity Prices.
This is a simple example explaining why.
If the Demand and the Supply for a particular commodity are stable (for example Crude) and the US Dollar appreciates 10%, then the price of this commodity appreciates also 10%. But as there is no additional demand to support this new price level the price of the commodity falls to find a new equilibrium between demand and supply. That means the commodity prices move always in the opposite direction to US Dollar.
As it was explained before, the Crude Oil is negatively correlated to the US Dollar. Actually, Crude Oil is negatively correlated to USDCAD and positive correlated to CADUSD.
From the other hand, a large part of Canada’s exports to the US derives from the sale of Crude Oil. That means that if the price of Crude increases the value of Canada's exports to US increases too. Canada exports about 2 million barrels of oil to the US every single day. Also, 85% of all Canada's exports are going to the US.
In other words, both sides of the USDCAD pair either affect or get affected by the Crude Oil.
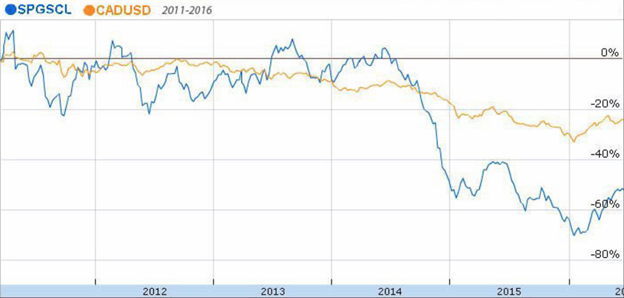
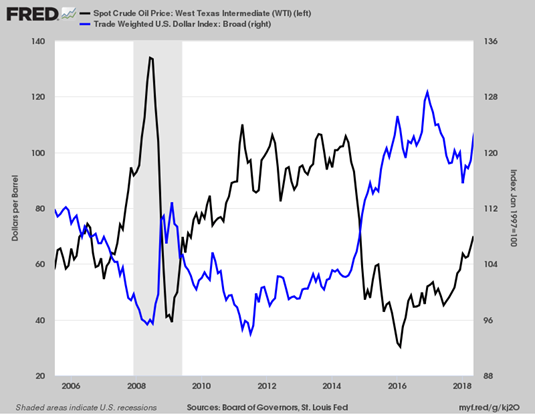
Historically, the price of oil is inversely related to the price of the U.S. dollar. The explanation for this relationship is based on two well-known premises.
A barrel of oil is priced in U.S. dollars across the world. When the U.S. dollar is strong, you need fewer U.S. dollars to buy a barrel of oil. When the U.S. dollar is weak, the price of oil is higher in dollar terms.
The United States has historically been a net importer of oil. Rising oil prices causes the United States’ trade balance deficit to rise as more dollars are needed to be sent abroad.
The former still holds true today, the latter….not so much. Due primarily to the success of horizontal drilling and fracking technology, the U.S. shale revolution has dramatically increased domestic petroleum production.
In fact, the United States became a net exporter of refined petroleum products in 2011 and is now the third-largest producer of crude oil after Saudi Arabia and Russia!
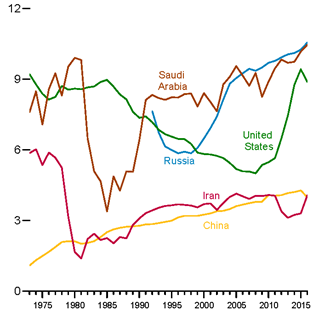
According to the Energy Information and Administration (EIA), the United States is now about 90% self-sufficient in terms of total energy consumption.
As U.S. oil exports have increased, oil imports have decreased. This means that higher oil prices no longer contribute to a higher U.S. trade deficit, and actually helps to decrease it.
As a result, we’ve seen the historically strong inverse relationship between oil prices and the U.S. dollar is becoming more unstable.
Over the past eight years, the rolling 6-month correlation coefficient was mostly negative but that’s starting to change.
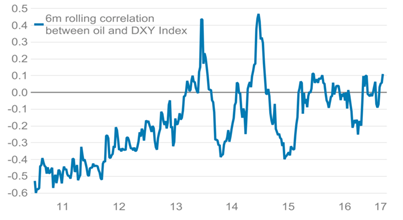
Considering the new dynamics of the global energy market, it wouldn’t be surprising to see this historically negative correlation spend more time in positive territory.
The relationship between oil and the United States seems to be changing, reflecting the country’s growing role in the global oil industry.
Bond yields differentials usually move in tandem with currency pairs. This phenomenon occurs because capital flows are attracted to higher yielding currencies. As the rate of one currency increases relative to another, investors are attracted to the higher yielding currency. Additionally, the cost of owning the lower yielding currency increase as the bond yield differential moves in favor of the currency that is sold. For example, the cost to owning the Yen and selling the dollar will increase as US bond yields increase relative to Japanese bond yields. Now, bond prices and bond yields are inversely correlated. When bond prices rise, bond yields fall and vice-versa.
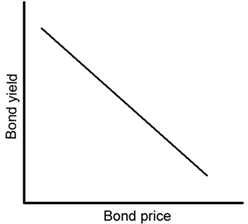
Always keep in mind that inter-market relationships govern currency price action.
Bond yields actually serve as an excellent indicator of the strength of a nation’s stock market, which increases demand for the nation’s currency.
The bond spread represents the difference between two countries’ bond yields.
These differences give rise to carry trade, which we discussed in a previous lesson.
By monitoring bond spreads and expectations for interest rate changes, you will have an idea where currency pairs are headed.
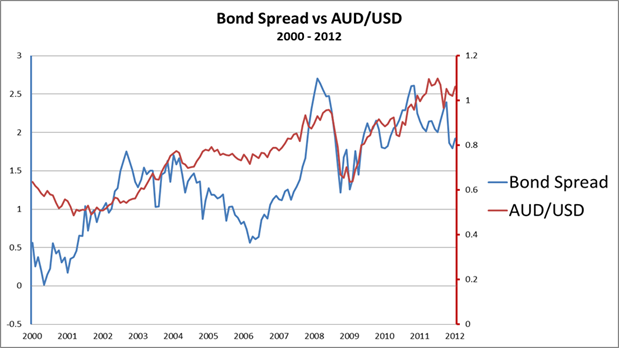
As the bond spread between two economies widens, the currency of the country with the higher bond yield appreciates against the other currency of the country with the lower bond yield. You can observe this phenomenon by looking at the graph of AUD/USD price action and the bond spread between Australian and U.S. 10-year government bonds from January 2000 to January 2012.
Notice that when the bond spread rose from 0.50% to 1.00% from 2002 to 2004, AUD/USD rose almost 50%, rising from .5000 to 0.7000. The same happened in 2007, when the bond differential rose from 1.00% to 2.50%, AUD/USD rose from .7000 to just above .9000.
That’s 2,000 pips! Once the recession of 2008 came along and all the major central banks started to cut their interest rates, AUD/USD plunged from the .9000 handle back down to 0.7000.
When bond spreads were increasing between the Aussie bonds and U.S. Treasuries, traders load up on their long AUD/USD positions. However, once the Reserve Bank of Australia started cutting rates and bond spreads began to tighten, traders reacted by unwinding their long AUD/USD positions, as they were no longer as profitable.
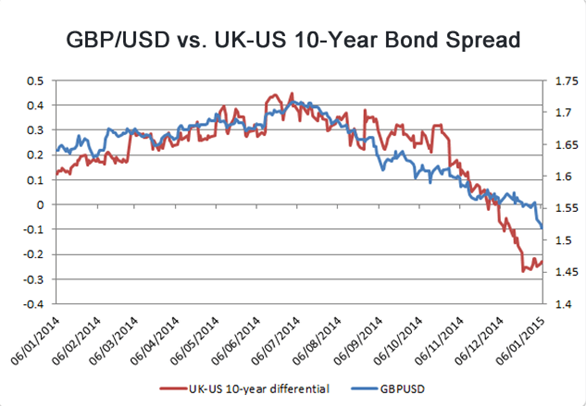
As the bond spread between the UK bond and US bond decreased, the GBP/USD weakened as well.
As the bond spread or interest rate differential between two economies increases, the currency with the higher bond yield or interest rate generally appreciates against the other.
Fixed income securities (including bonds) are investments that offer a fixed payment at regular time intervals.Economies that offer higher returns on their fixed income securities should attract more investments.
For instance, let’s consider gilts and Euribors (we’re talking about U.K. bonds and European securities here!). If Euribors are offering a lower rate of return compared to gilts, investors would be discouraged from putting their money in euro zone’s fixed income market and would rather place their money in higher-yielding assets.
Because of that, the EUR could weaken against other currencies, particularly the GBP. This phenomenon applies to virtually any fixed income market and for any currency. You can compare the yields on the fixed income securities of Brazil to the fixed income market of Russia and use the differentials to predict the behavior of the real and the ruble.
Here are some of the popular bonds from around the globe and their cool nicknames:
|
ECONOMY |
BONDS OFFERED |
|
United States |
U.S. Treasury bonds, Yankee bonds |
|
United Kingdom |
Gilts, Bulldog bonds |
|
Japan |
Japanese bonds, Samurai bonds |
|
Eurozone |
Eurozone bonds, Euribors |
|
Germany |
Bunds |
|
Switzerland |
Swiss bonds |
|
Canada |
Canadian Bonds |
|
Australia |
Australian Bonds, kangaroo bonds, Matilda bonds |
|
New Zealand |
New Zealand bonds, Kiwi bonds |
|
Spain |
Matador bonds |
*The information presented above is intended for informative and educational purposes, should not be considered as investment advice, or an offer or solicitation for a transaction in any financial instrument and thus should not be treated as such. Past performance is not a reliable indicator of future results.

Cairo Investment Expo 2021
Ultimate FinTech Awards 2022
European Fintech 2022
2023 Global Forex Awards
Cairo Investment Expo 2021
Ultimate FinTech Awards 2022
European Fintech 2022
2023 Global Forex Awards
Online Chat Chat with us
Email:supportsohomarkets.com
ลิขสิทธิ์ © 2024 - สงวนลิขสิทธิ์
Soho Markets LLC ก่อตั้งขึ้นในเซนต์วินเซนต์และเกรนาดีนส์ในฐานะบริษัทธุรกิจระหว่างประเทศ โดยมีหมายเลขจดทะเบียน 1310 LLC 2021
คำเตือนความเสี่ยง: CFD เป็นตราสารที่ซับซ้อนและมีความเสี่ยงสูงที่จะสูญเสียเงินอย่างรวดเร็วเนื่องจากเลเวอเรจ คุณควรพิจารณาว่าคุณเข้าใจวิธีการทำงานของ CFD หรือไม่ และคุณสามารถที่จะรับความเสี่ยงสูงในการสูญเสียเงินได้หรือไม่ โปรดอ่านการเปิดเผยความเสี่ยงฉบับเต็ม
ข้อจำกัดระดับภูมิภาค: SOHO MARKETS GLOBAL LIMITED ไม่ได้ให้บริการในดินแดนของสหรัฐอเมริกา แคนาดา อิสราเอล ญี่ปุ่น เกาหลีเหนือ เบลเยียม และประเทศที่ถูกคว่ำบาตรของ UN/EU
Soho Markets Global Limited และ Soho Markets LLC ไม่ได้ให้บริการแก่ลูกค้าในสหภาพยุโรป ลูกค้าในสหภาพยุโรปสามารถรับบริการได้โดย Vstar & Soho Markets Ltd. เท่านั้น
ข้อตกลงลูกค้า (ข้อกำหนดและเงื่อนไข) นโยบายความเป็นส่วนตัว การเปิดเผยความเสี่ยง