
入金方式


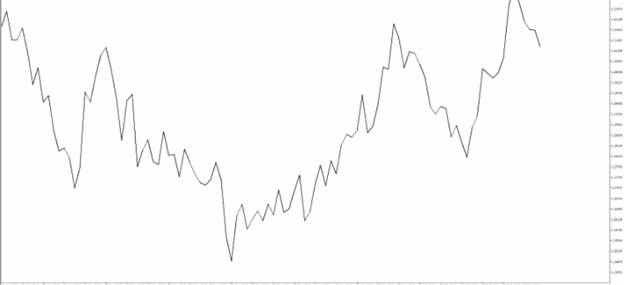
A line chart connects the closing prices of the timeframe you are viewing. So, when viewing a daily chart the line connects the closing price of each trading day. This is the most basic type of chart used by traders. It is mainly used to identify bigger picture trends but does not offer much else unlike some of the other chart types:
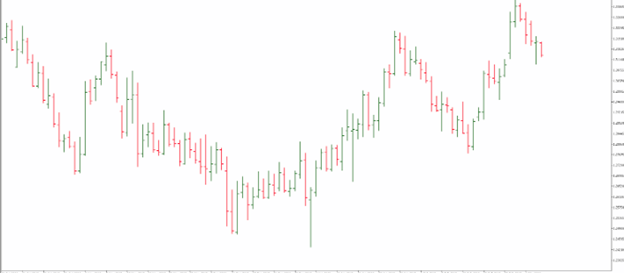
An OHLC bar chart shows a bar for each time period the trader is viewing. So, when looking at a daily chart, each vertical bar represents one day's worth of trading. The bar chart is unique as it offers much more than the line chart such as the open, high, low and close (OHLC) values of the bar.
The dash on the left represents the opening price and the dash on the right represents the closing price. The high of the bar is the highest price the market traded during the time period selected. The low of the bar is the lowest price the market traded during the time period selected.
2. The red bars are known as seller bars as the closing price is below the opening price.
In either case, the OHLC bar charts help traders identify who is in control of the market - buyers or sellers. These bars form the basis of the next chart type called candlestick charts which is the most popular type of forex charting:
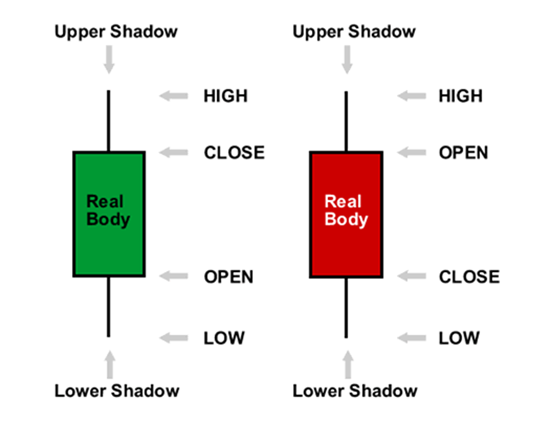
Candlestick charts were first used by Japanese rice traders in the 18th century. They are similar to OHLC bars in the fact they also give the open, high, low and close values of a specific time period. However, candlestick charts have a box between the open and close price values. This is also known as the 'body' of the candlestick.
Many traders find candlestick charts the most visually appealing when viewing live forex charts. They are also very popular as they provide a variety of price action patterns used by traders all over the world.
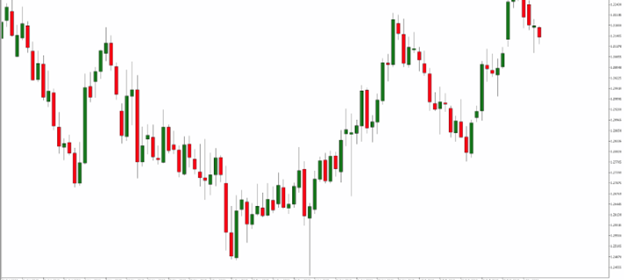
1. Candlesticks are easy to interpret, and are a good place for beginners to start figuring out forex chart analysis.
2. Candlesticks are easy to use! Your eyes adapt almost immediately to the information in the bar notation.
3. Candlesticks are good at identifying market turning points – reversals from an uptrend to a downtrend or a downtrend to an uptrend.
*The information presented above is intended for informative and educational purposes, should not be considered as investment advice, or an offer or solicitation for a transaction in any financial instrument and thus should not be treated as such. Past performance is not a reliable indicator of future results.

2021开罗投资博览会
2022年终极金融科技奖
2022欧洲金融科技
2023全球外汇奖
版权所有 © 2024
Soho Markets LLC在圣文森特和格林纳丁斯注册为国际商业公司(International Business Company),注册号为1310 LLC 2021
风险提示:差价合约(CFDs)是复杂的工具,由于杠杆作用带来亏损的风险很高。请您考虑是否了解差价合约(CFDs)的工作原理,以及是否有能力承担资金亏损的高风险。请阅读完整的风险披露
区域限制:SOHO MARKETS GLOBAL LIMITED不为美国、加拿大、以色列、日本、朝鲜、比利时和联合国/欧盟制裁国家提供服务