
입금 방법


Moving averages are probably the most common indicator used by forex traders and although it is a simple tool, it provides invaluable data. Simply put, moving averages measures the average movement of the market for an X amount of time, where X is whatever you want it to be.
The two basic and commonly used moving averages are the simple moving average (SMA), which is the simple average of a security over a defined number of time periods, and the exponential moving average (EMA), which gives greater weight to more recent prices.
The SMA, is calculated by taking the arithmetic mean of a given set of values. In other words, a set of numbers, or prices in the case of financial instruments, are added together and then divided by the number of prices in the set. The EMA is a type of moving average that gives more weight to recent prices in an attempt to make it more responsive to new information. Learning the somewhat complicated equation for calculating an EMA may be unnecessary for many traders, since nearly all charting packages do the calculations for you.
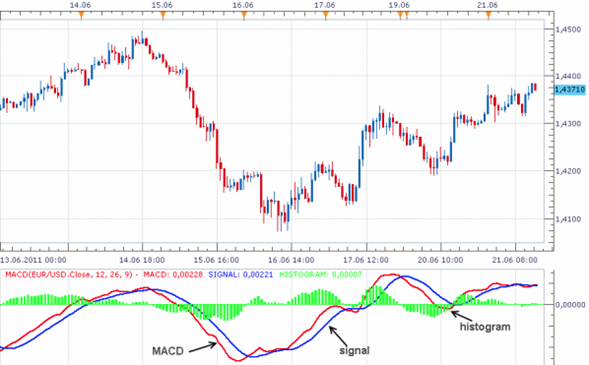
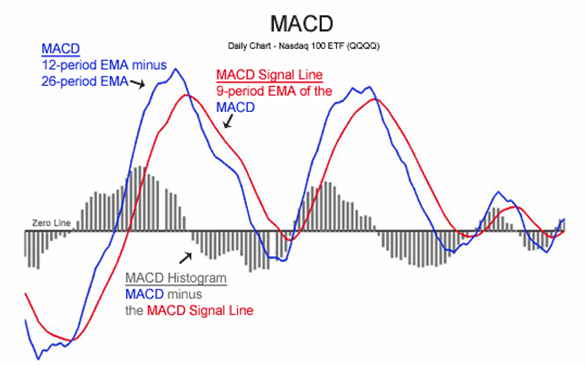
Moving Average Convergence Divergence (MACD) is a trend-following momentum indicator that shows the relationship between two moving averages of a security’s price. The MACD is calculated by subtracting the 26-period Exponential Moving Average (EMA) from the 12-period EMA. MACD is one of the most common indicators used by forex traders and for good reason. It is simple yet dependable and can help you find momentum, and in this case, the lack of momentum!
MACD can be displayed in several ways but one of the best ways is to look at it as a histogram. What this histogram does is actually show the difference between the slow and fast MACD line. When the histogram gets bigger, it means momentum is getting stronger. When the histogram gets smaller, it means momentum is getting weaker.
Since MACD shows us momentum it would make sense that momentum would increase as the market makes a trend. However, if MACD begins to decrease even when the trend is continuing, you can deduce that momentum is decreasing and this trend could be close to an end.
The result of that calculation is the MACD line. A nine-day EMA of the MACD called the "signal line," is then plotted on top of the MACD line, which can function as a trigger for buy and sell signals. Traders may buy the security when the MACD crosses above its signal line and sell - or short - the security when the MACD crosses below the signal line. Moving Average Convergence Divergence (MACD) indicators can be interpreted in several ways, but the more common methods are crossovers, divergences, and rapid rises/falls.
With an MACD chart, you will usually see three numbers that are used for its settings.
1. The first is the number of periods that is used to calculate the faster-moving average.
2. The second is the number of periods that is used in the slower moving average.
3. And the third is the number of bars that is used to calculate the moving average of the difference between the faster and slower moving averages.
For example, if you were to see “12, 26, 9” as the MACD parameters (which is usually the default setting for most charting software), this is how you would interpret it:
1. The 12 represents the previous 12 bars of the faster moving average.
2. The 26 represents the previous 26 bars of the slower moving average.
3. The 9 represents the previous 9 bars of the difference between the two moving averages. This is plotted by vertical lines called a histogram (the green lines in the chart above).
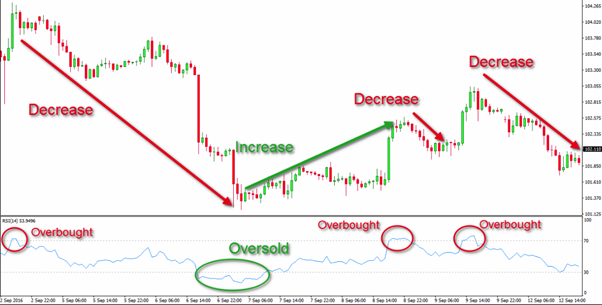
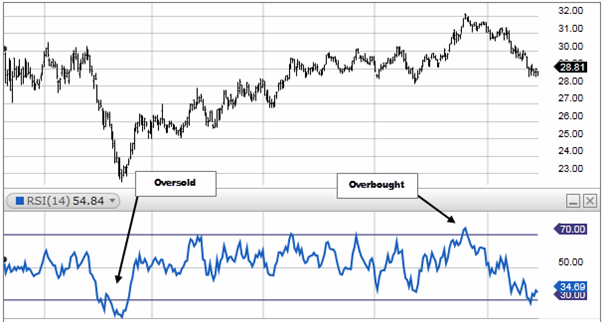
RSI is another momentum indicator that is useful for confirming reversal breakouts.
Basically, this indicator tells us the changes between higher and lower closing prices for a given period of time. RSI can be used in a similar way to MACD in that it also produces divergences. By spotting these divergences, you can find possible trend reversals.
However, RSI is also good for seeing how long a trend has been overbought or oversold. A common indication of whether a market is overbought is if the RSI is above 70. On the flipside, a common indication of whether a market is oversold is if the RSI is below 30.
Because trends are movements in the same direction for an extended period of time, you will often see RSI move into overbought/oversold territory, depending on the direction of the trend.
If a trend has produced oversold or overbought readings for an extended period of time and begins to move back within the range of the RSI, it is a good indication that the trend may be reversing.
The average true range (ATR) is a technical analysis indicator that measures market volatility by decomposing the entire range of an asset price for that period. Specifically, ATR is a measure of volatility introduced by market technician J. Welles Wilder Jr. in his book, "New Concepts in Technical Trading Systems."
The true range indicator is taken as the greatest of the following: current high less the current low; the absolute value of the current high less the previous close; and the absolute value of the current low less the previous close. The average true range is then a moving average, generally using 14 days, of the true ranges.
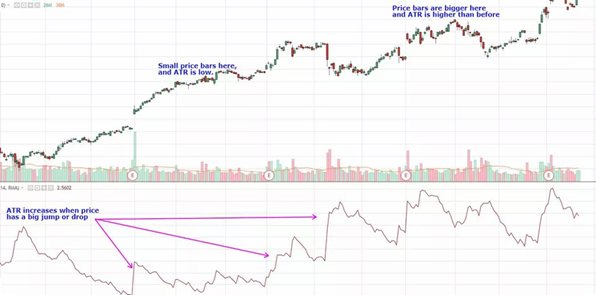
When ATR is falling, it is an indication that volatility is decreasing.
When ATR is rising, it is an indication that volatility has been on the rise.
The parabolic SAR is a technical indicator used to determine the price direction of an asset, as well as draw attention to when the price direction is changing. Sometimes known as the "stop and reversal system," the parabolic SAR was developed by J. Welles Wilder Jr., creator of the relative strength index (RSI).
On a chart, the indicator appears as a series of dots placed either above or below the price bars. A dot below the price is deemed to be a bullish signal. Conversely, a dot above the price is used to illustrate that the bears are in control and that the momentum is likely to remain downward. When the dots flip, it indicates that a potential change in price direction is under way. For example, if the dots are above the price, when they flip below the price, it could signal a further rise in price.
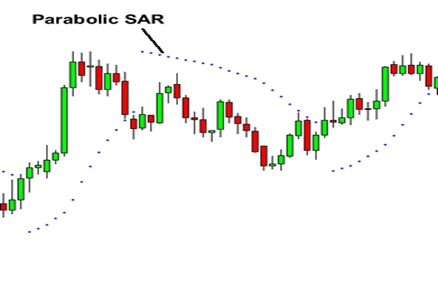
As the price of a stock rises, the dots will rise as well, first slowly and then picking up speed and accelerating with the trend. The SAR starts to move a little faster as the trend develops, and the dots soon catch up to the price. The following chart shows that the indicator works well for capturing profits during a trend, but it can lead to many false signals when the price moves sideways or is trading in a choppy market. The indicator would have kept the trader in the trade while the price rose. When the price is moving sideways, the trader should expect more losses and/or small profits. From the image above, you can see that the dots shift from being below the candles during the uptrend to above the candles when the trend reverses into a downtrend.
Basically, when the dots are below the candles, it is a BUY signal.
When the dots are above the candles, it is a SELL signal.
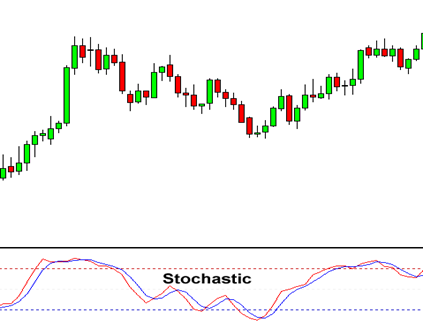
The stochastic indicator is a momentum indicator developed by George C. Lane in the 1950s, which shows the position of the most recent closing price relative to the previous high-low range. The indicator measures momentum by comparing the closing price with the previous trading range over a specific period of time.
The stochastic indicator does not follow the price or volume of the underlying currency pair, but the speed and momentum of the price. This means that the stochastic indicator changes direction before the price itself and can thus be considered a leading indicator. The most important signals that Lane identified are the bullish and bearish divergences that form on the stochastic indicator, which can anticipate upcoming price reversals. However, as the stochastic indicator oscillates within a range, it can also be used to identify overbought and oversold price levels.
The 2 lines are similar to the MACD lines in the sense that one line is faster than the other. The Stochastic is scaled from 0 to 100. When the Stochastic lines are above 80 (the red dotted line in the chart above), then it means the market is overbought so is good to sell.
When the Stochastic lines are below 20 (the blue dotted line), then it means that the market is oversold so is good to buy.
Relative Strength Index, or RSI is similar to the stochastic in that it identifies overbought and oversold conditions in the market.
It is also scaled from 0 to 100.
Typically, readings below 30 indicate oversold market conditions.
Readings over 70 indicate overbought conditions.
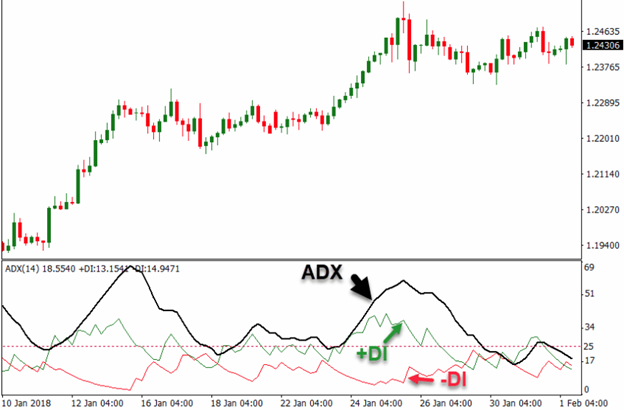
The Average Directional Movement Index (ADX) technical analysis indicator describes when a market is trending or not trending. It fluctuates from 0 to 100, with readings below 20 indicating a weak trend and readings above 50 signaling a strong trend.
However, the main purpose of the ADX is to determine whether a stock, future, or currency pair is trending or is in a trading range. Determining which mode a market is in is helpful because it can guide a trader to which other technical analysis indicators to use.
*The information presented above is intended for informative and educational purposes, should not be considered as investment advice, or an offer or solicitation for a transaction in any financial instrument and thus should not be treated as such. Past performance is not a reliable indicator of future results.

Cairo Investment Expo 2021
Ultimate FinTech Awards 2022
European Fintech 2022
2023 Global Forex Awards
Cairo Investment Expo 2021
Ultimate FinTech Awards 2022
European Fintech 2022
2023 Global Forex Awards
Online Chat Chat with us
Email:supportsohomarkets.com
저저작권 © 2024 - 모든 권리 보유.
Soho Markets LLC는 등록 번호 1310 LLC 2021로 세인트 빈센트 그레나딘에 국제 비즈니스 회사로 설립되었습니다.
위험 경고: CFD는 복잡한 상품이며 레버리지로 인해 빠르게 돈을 잃을 위험이 높습니다. CFD의 작동 방식을 이해하고 있는지, 돈을 잃을 위험을 감수할 여유가 있는지 고려해야 합니다. 전체 위험 공개를 읽어보시기 바랍니다.
지역 제한: SOHO MARKETS GLOBAL LIMITED는 미국, 캐나다, 이스라엘, 일본, 북한, 벨기에 및 UN/EU 제재 국가의 지역에서는 서비스를 제공하지 않습니다.
Soho Markets Global Limited 및 Soho Markets LLC는 EU 고객에게 서비스를 제공하지 않습니다. EU 고객은 Vstar & Soho Markets Ltd를 통해서만 서비스를 받을 수 있습니다.