
입금 방법


Leonardo Fibonacci was a famous Italian mathematician that discovered a simple series of numbers that created ratios describing the natural proportions of things in the universe.
The ratios arise from the following number series: 0, 1, 1, 2, 3, 5, 8, 13, 21, 34, 55, 89, 144…
This series of numbers is derived by starting with 0 followed by 1 and then adding 0 + 1 to get 1, the third number. Then, adding the second and third number (1 + 1) to get 2, the fourth number, and so on. After the first few numbers in the sequence, if you measure the ratio of any number to the succeeding higher number, you get .618. For example, 34 divided by 55 equals .618. If you measure the ratio between alternate numbers you get .382. For example, 34 divided by 89 = 0.382.
A Fibonacci retracement is a term used in technical analysis that refers to areas of support or resistance. Fibonacci retracement levels use horizontal lines to indicate where possible support and resistance levels are. Each level is associated with a percentage. The percentage is how much of a prior move the price has retraced. The Fibonacci retracement levels are 23.6%, 38.2%, 61.8% and 78.6%. While not officially a Fibonacci ratio, 50% is also used. The indicator is useful because it can be drawn between any two significant price points, such as a high and a low, and then the indicator will create the levels between those two points.
Fibonacci extensions are a tool that traders can use to establish profit targets or estimate how far a price may travel after a retracement/pullback is finished. Extension levels are also possible areas where the price may reverse. Extensions are drawn on a chart, marking price levels of possible importance. These levels are based on Fibonacci ratios (as percentages) and the size of the price move the indicator is being applied to. Common Fibonacci extension levels are 61.8%, 100%, 161.8%, 200%, and 261.8%.
This is a daily chart of AUD/USD showing an uptrend
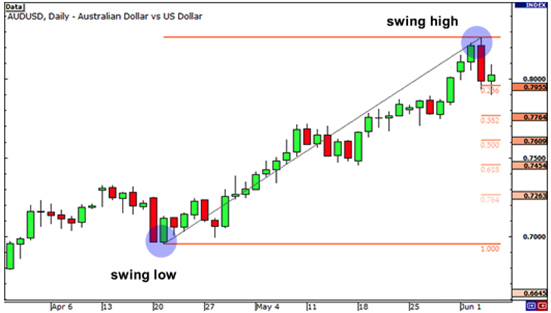
Here we plotted the Fibonacci retracement levels by clicking on the Swing Low at .6955 on April 20 and dragging the cursor to the Swing High at .8264 on June 3. As you can see from the chart, the Fibonacci retracement levels were .7955 (23.6%), .7764 (38.2%), .7609 (50.0%), .7454 (61.8%), and .7263 (76.4%). Now, the expectation is that if AUD/USD retraces from the recent high, it will find support at one of those Fibonacci retracement levels because traders will be placing buy orders at these levels as price pulls back.
Now, let’s look at what happened after the Swing High occurred.
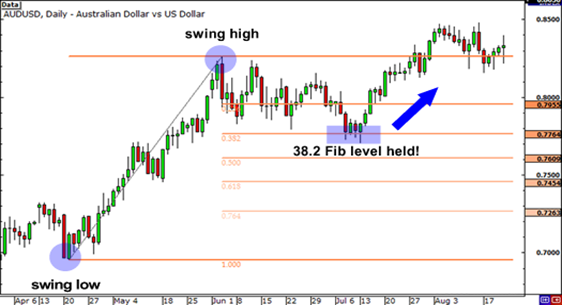
Price pulled back right through the 23.6% level and continued to shoot down over the next couple of weeks. It even tested the 38.2% level but was unable to close below it. Later on, around July 14, the market resumed its upward move and eventually broke through the swing high. Clearly, buying at the 38.2% Fibonacci level would have been a profitable long-term trade!
Now, let’s see how we would use the Fibonacci retracement tool during a downtrend. Below is a chart of EUR/USD.
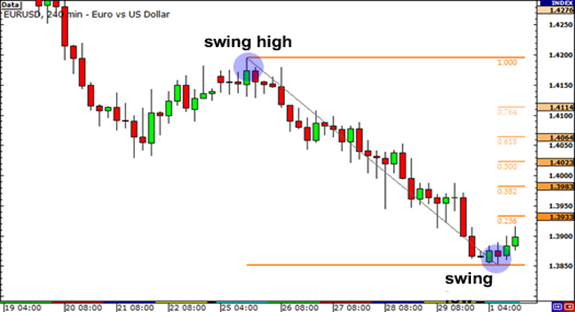
As you can see, we found our Swing High at 1.4195 on January 25 and our Swing Low at 1.3854 a few days later on February 1.
The retracement levels are 1.3933 (23.6%), 1.3983 (38.2%), 1.4023 (50.0%), 1.4064 (61.8%) and 1.4114 (76.4%). The expectation for a downtrend is that if price retraces from this low, it could possibly encounter resistance at one of the Fibonacci levels because traders who want to play the downtrend at better prices may be ready with sell orders there.
Let’s take a look at what happened next.
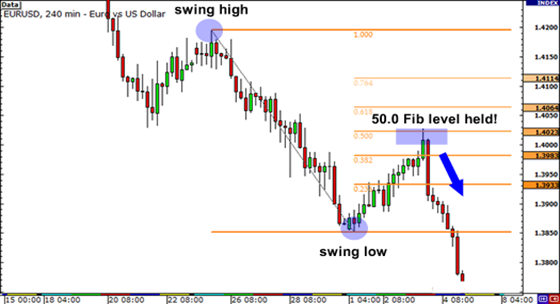
The market did try to rally, stalled below the 38.2% level for a bit before testing the 50.0% level.
If you had some orders either at the 38.2% or 50.0% levels, you would’ve made some mad pips on that trade. In these two examples, we see that price found some temporary forex support or resistance at Fibonacci retracement levels.
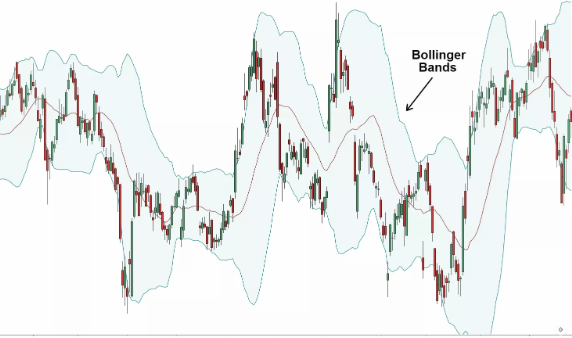
A Bollinger Band® is a technical analysis tool defined by a set of lines plotted two standard deviations (positively and negatively) away from a simple moving average (SMA) of the security's price but can be adjusted to user preferences. Bollinger Bands® were developed and copyrighted by famous technical trader John Bollinger. A Bollinger Band® technical indicator has bands generally placed two standard deviations away from a simple moving average. In general, a move toward the upper band suggests the asset is becoming overbought, while a move close to the lower band suggests the asset is becoming oversold. Since standard deviation is used as a statistical measure of volatility, this indicator adjusts itself to market conditions.
Bollinger bands® are excellent tools for measuring volatility because that is exactly what it was designed to do. Bollinger bands® are basically 2 lines that are plotted 2 standard deviations above and below a moving average for an X amount of time, where X is whatever you want it to be.
So if we set it at 20, we would have a 20 SMA and two other lines. One line would be plotted +2 standard deviations above it and the other line would be plotted -2 standard deviations below.
When the bands contract, it tells us that volatility is LOW.
When the bands widen, it tells us that volatility is HIGH.
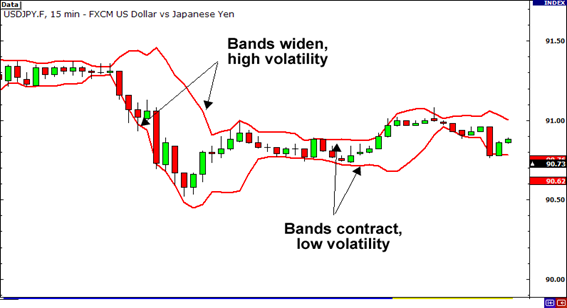
In the chart depicted below, Bollinger Bands® bracket the 20-day SMA of the stock with an upper and lower band along with the daily movements of the stock's price. Because standard deviation is a measure of volatility, when the markets become more volatile the bands widen; during less volatile periods, the bands contract.
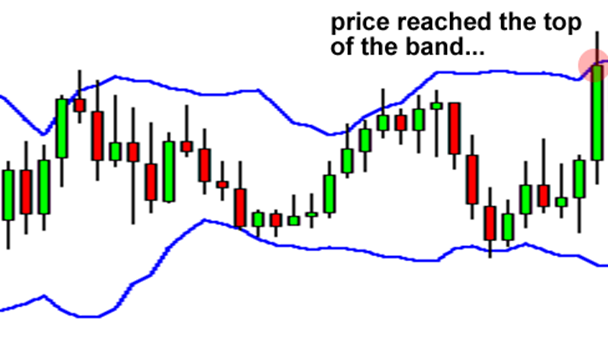
One thing you should know about Bollinger Bands® is that price tends to return to the middle of the bands. That is the whole idea behind the “Bollinger Bounce.”
As you can see, the price settled back down towards the middle area of the bands.
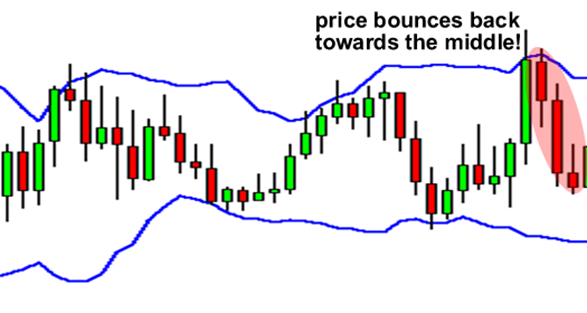
What you just saw was a classic Bollinger Bounce. The reason these bounces occur is because Bollinger bands® act like dynamic support and resistance levels. The longer the time frame you are in, the stronger these bands tend to be. Many traders have developed systems that thrive on these bounces and this strategy is best used when the market is ranging and there is no clear trend.
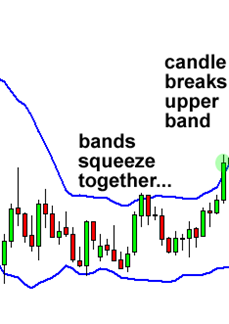
The “Bollinger Squeeze” is pretty self-explanatory. When the bands squeeze together, it usually means that a breakout is getting ready to happen. Bollinger Bands® Squeeze is a great chart pattern that enables you to locate strong and profitable trade setups. When the market becomes too slow and there is a low volatility, the price moves sideways and the Bollinger upper and lower bands become so close to each other
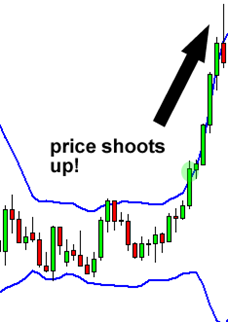
If the candles start to break out above the TOP band, then the move will usually continue to go UP. If the candles start to break out below the BOTTOM band, then price will usually continue to go DOWN.
*The information presented above is intended for informative and educational purposes, should not be considered as investment advice, or an offer or solicitation for a transaction in any financial instrument and thus should not be treated as such. Past performance is not a reliable indicator of future results.

Cairo Investment Expo 2021
Ultimate FinTech Awards 2022
European Fintech 2022
2023 Global Forex Awards
Cairo Investment Expo 2021
Ultimate FinTech Awards 2022
European Fintech 2022
2023 Global Forex Awards
Online Chat Chat with us
Email:supportsohomarkets.com
저저작권 © 2024 - 모든 권리 보유.
Soho Markets LLC는 등록 번호 1310 LLC 2021로 세인트 빈센트 그레나딘에 국제 비즈니스 회사로 설립되었습니다.
위험 경고: CFD는 복잡한 상품이며 레버리지로 인해 빠르게 돈을 잃을 위험이 높습니다. CFD의 작동 방식을 이해하고 있는지, 돈을 잃을 위험을 감수할 여유가 있는지 고려해야 합니다. 전체 위험 공개를 읽어보시기 바랍니다.
지역 제한: SOHO MARKETS GLOBAL LIMITED는 미국, 캐나다, 이스라엘, 일본, 북한, 벨기에 및 UN/EU 제재 국가의 지역에서는 서비스를 제공하지 않습니다.
Soho Markets Global Limited 및 Soho Markets LLC는 EU 고객에게 서비스를 제공하지 않습니다. EU 고객은 Vstar & Soho Markets Ltd를 통해서만 서비스를 받을 수 있습니다.