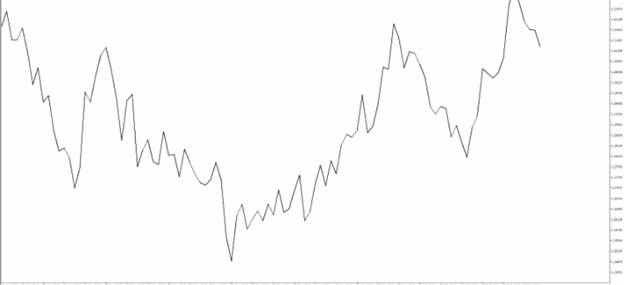
A line chart connects the closing prices of the timeframe you are viewing. So, when viewing a daily chart the line connects the closing price of each trading day. This is the most basic type of chart used by traders. It is mainly used to identify bigger picture trends but does not offer much else unlike some of the other chart types:

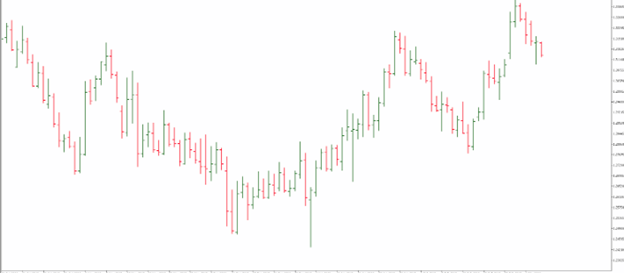
An OHLC bar chart shows a bar for each time period the trader is viewing. So, when looking at a daily chart, each vertical bar represents one day's worth of trading. The bar chart is unique as it offers much more than the line chart such as the open, high, low and close (OHLC) values of the bar.
The dash on the left represents the opening price and the dash on the right represents the closing price. The high of the bar is the highest price the market traded during the time period selected. The low of the bar is the lowest price the market traded during the time period selected.
2. The red bars are known as seller bars as the closing price is below the opening price.
In either case, the OHLC bar charts help traders identify who is in control of the market - buyers or sellers. These bars form the basis of the next chart type called candlestick charts which is the most popular type of forex charting:

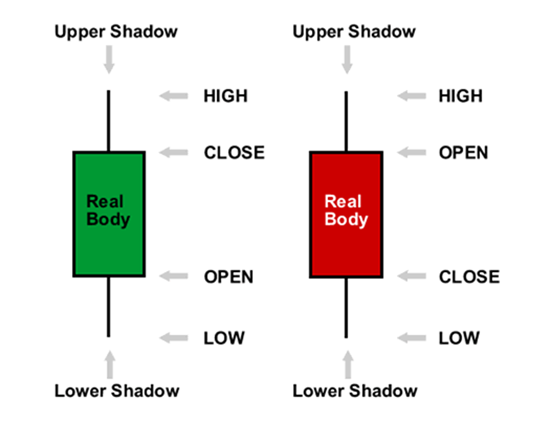
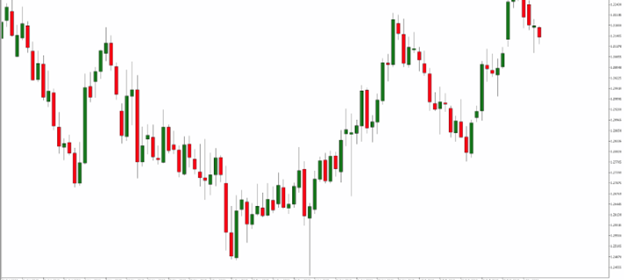
Candlestick charts were first used by Japanese rice traders in the 18th century. They are similar to OHLC bars in the fact they also give the open, high, low and close values of a specific time period. However, candlestick charts have a box between the open and close price values. This is also known as the 'body' of the candlestick.
Many traders find candlestick charts the most visually appealing when viewing live forex charts. They are also very popular as they provide a variety of price action patterns used by traders all over the world.


1. Candlesticks are easy to interpret, and are a good place for beginners to start figuring out forex chart analysis.
2. Candlesticks are easy to use! Your eyes adapt almost immediately to the information in the bar notation.
3. Candlesticks are good at identifying market turning points – reversals from an uptrend to a downtrend or a downtrend to an uptrend.
*The information presented above is intended for informative and educational purposes, should not be considered as investment advice, or an offer or solicitation for a transaction in any financial instrument and thus should not be treated as such. Past performance is not a reliable indicator of future results.

Cairo Investment Expo 2021
Ultimate FinTech Awards 2022
European Fintech 2022
2023 Global Forex Awards
Cairo Investment Expo 2021
Ultimate FinTech Awards 2022
European Fintech 2022
2023 Global Forex Awards
Online Chat Chat with us
Email:supportsohomarkets.com
저저작권 © 2024 - 모든 권리 보유.
Soho Markets LLC는 등록 번호 1310 LLC 2021로 세인트 빈센트 그레나딘에 국제 비즈니스 회사로 설립되었습니다.
위험 경고: CFD는 복잡한 상품이며 레버리지로 인해 빠르게 돈을 잃을 위험이 높습니다. CFD의 작동 방식을 이해하고 있는지, 돈을 잃을 위험을 감수할 여유가 있는지 고려해야 합니다. 전체 위험 공개를 읽어보시기 바랍니다.
지역 제한: SOHO MARKETS GLOBAL LIMITED는 미국, 캐나다, 이스라엘, 일본, 북한, 벨기에 및 UN/EU 제재 국가의 지역에서는 서비스를 제공하지 않습니다.
Soho Markets Global Limited 및 Soho Markets LLC는 EU 고객에게 서비스를 제공하지 않습니다. EU 고객은 Vstar & Soho Markets Ltd를 통해서만 서비스를 받을 수 있습니다.