V&Sグループの一員
Imagine this scenario. Price starts to rise. Keeps rising. Then it starts falling. And falling some more. And then it starts going back up.
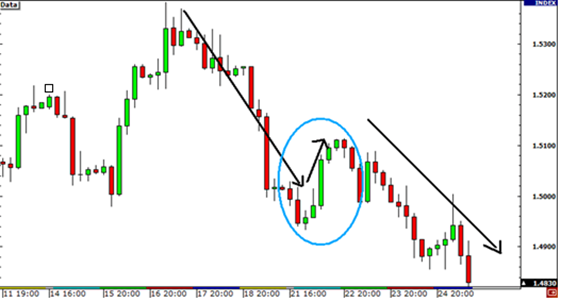
This is called the “Smooth Retracement!”
In the above example, the forex trader failed to recognize the difference between a retracement and a reversal.
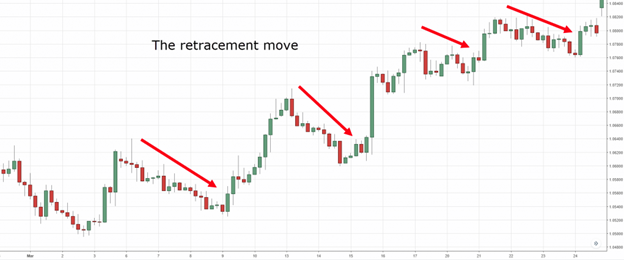
Retracements are temporary price reversals that take place within a larger trend. The key here is that these price reversals are temporary and do not indicate a change in the larger trend.
Notice that, despite the retracements, the long-term trend shown in the chart below is still intact. The price of the stock is still going up. When the price moves up, it makes a new high, and when it drops, it begins to rally before reaching the previous low. This movement is one of the tenets of an uptrend, where there are higher highs and higher lows. While that is occurring, the trend is up. It is only once an uptrend makes a lower low and lower high that the trend is drawn into question and a reversal could be forming.
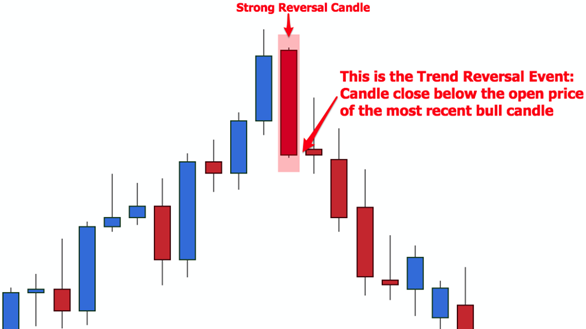
A reversal, on the other hand, is when the price trend of an asset changes direction. It means that the price is likely to continue in that reversal direction for an extended period. These directional changes can happen to the upside after a downward trend or the downside after an upward trend.
Most often the change is a large shift in price. However, there may be pullbacks where the price recovers the previous direction. It is impossible to tell immediately if a temporary price correction is a pullback or the continuation of the reversal. The change can be a sudden shift or can take days, weeks, or even years to materialize.
The moving average (MA) and trendlines help traders to identify reversals. Intraday reversals are important to day traders, but longer holding funds or investors may focus on changes over months or quarters. As shown on the image below, when the price drops under the MA or a drawn trendline, traders know to watch for a potential reversal.
Properly distinguishing between retracements and reversals can reduce the number of losing trades. Classifying a price movement as a retracement or a reversal is very important.
There are several key differences in distinguishing a temporary price change retracement from a long-term trend reversal. Here they are:
|
|
|
|
|
|
|
|
|
|
A popular way to identify retracements is to use Fibonacci levels. For the most part, price retracements hang around the 38.2%, 50.0% and 61.8% Fibonacci retracement levels before continuing the overall trend. If price goes beyond these levels, it may signal that a reversal is happening. Notice how we didn’t say will.
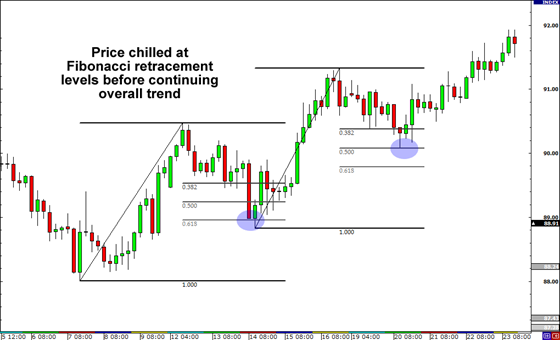
In this case, price took a breather and rested at the 61.8% Fibonacci retracement level before resuming the uptrend. After a while, it pulled back again and settled at the 50% retracement level before heading higher.
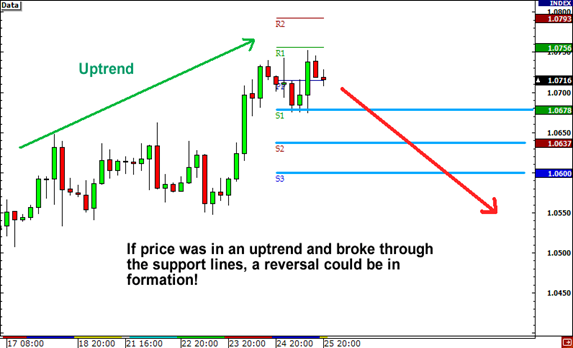
Another way to see if price is staging a reversal is to use pivot points. In an UPTREND, traders will look at the lower support points (S1, S2, S3) and wait for it to break. In a DOWNTREND, forex traders will look at the higher resistance points (R1, R2, R3) and wait for it to break.
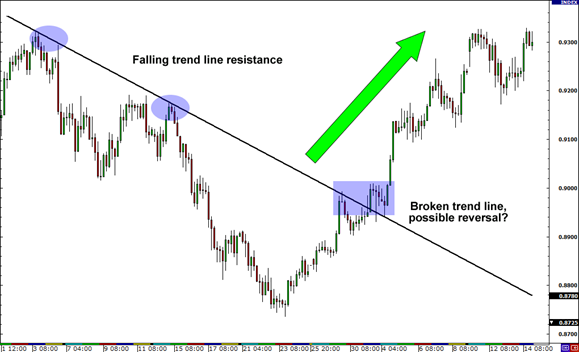
The last method is to use trend lines. When a major trend line is broken, a reversal may be in effect. By using this technical tool in conjunction with candlestick chart patterns discussed earlier, a forex trader may be able to get a high probability of a reversal.
*The information presented above is intended for informative and educational purposes, should not be considered as investment advice, or an offer or solicitation for a transaction in any financial instrument and thus should not be treated as such. Past performance is not a reliable indicator of future results.

Cairo Investment Expo 2021
Ultimate FinTech Awards 2022
European Fintech 2022
2023 Global Forex Awards
Cairo Investment Expo 2021
Ultimate FinTech Awards 2022
European Fintech 2022
2023 Global Forex Awards
Online Chat Chat with us
Email:supportsohomarkets.com
著作権 © 2024 - 無断複写・転載を禁じます。
Soho Markets LLC は、国際事業会社としてセントビンセントおよびグレナディーン諸島に設立されており、登録番号は
1310 LLC 2021 です。
リスク警告: CFD は複雑な商品であり、レバレッジにより急速に資金を失う高いリスクが伴います。
CFD の仕組みを理解しているかどうか、また、お金を失う高いリスクを冒す余裕があるかどうかを検討する必要があります。
リスク開示の全文をお読みください。
地域制限: SOHO MARKETS GLOBAL LIMITED は、アメリカ合衆国、カナダ、イスラエル、日本、北朝鮮、ベルギー、および国連/EU
制裁対象国の領土ではサービスを提供しません。
Soho Markets Global Limited および
Soho Markets LLC は、EU の顧客にサービスを提供しません。
EU の顧客には Vstar & Soho Markets Ltd のみがサービスを提供できます。