
入金 方法


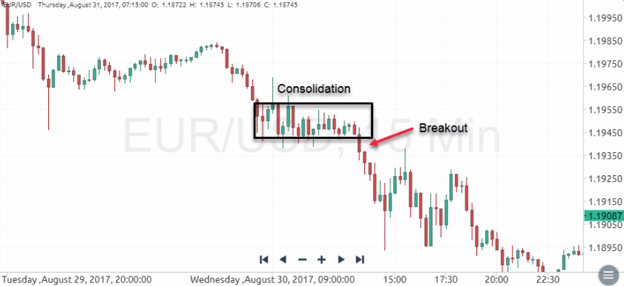
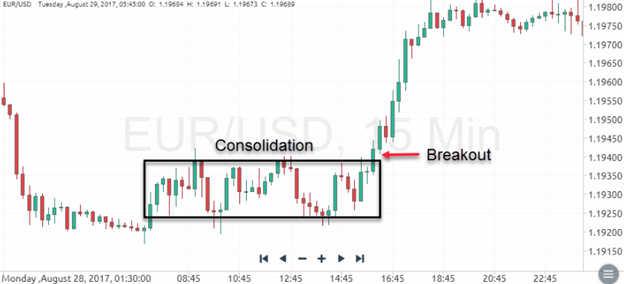
A breakout occurs when the price “breaks out” of some kind of consolidation or trading range.
A breakout can also occur when a specific price level is breached such as support and resistance levels, pivot points, Fibonacci levels, etc.
With breakout trades, the goal is to enter the market right when the price makes a breakout and then continue to ride the trade until volatility dies down.
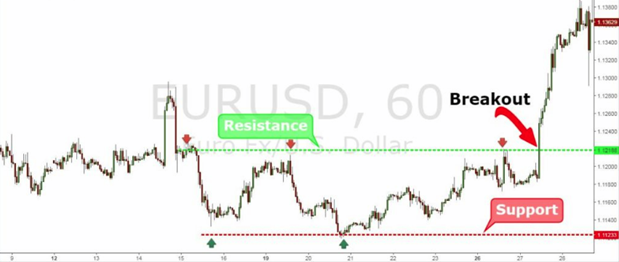
When trading breakouts, it is important to consider the underlying stock's support and resistance levels. The more times a stock price has touched these areas, the more valid these levels are and the more important they become. At the same time, the longer these support and resistance levels have been in play, the better the outcome when the stock price finally breaks out
Volatility is something that we can use when looking for good breakout trade opportunities.
Volatility measures the overall price fluctuations over a certain time and this information can be used to detect potential breakouts.
There are a few indicators that can help you gauge a pair’s current volatility.
Using these indicators can help you tremendously when looking for breakout opportunities.
When trading breakouts in forex, it is important to realize that there are 3 main types:
1. Continuation breakouts
2. Reversal breakouts
3. False breakouts
Knowing what type of breakout you are seeing will help you make sense of what is actually happening in the big picture of the market.
Breakouts are significant because they indicate a change in the supply and demand of the currency pair you are trading.
This change in sentiment can cause extensive moves that provide excellent opportunities for you to grab some pips.
A continuation breakout is a breakout which continues in the same direction as the main trend. They occur after the price consolidates (range-bound market) after a significant move in price.
Continuation breakouts are situations where major players break out of trading ranges after periods of consolidation. Here traders take a breather after a long-protracted battle trying to jockey for trading position. Once they’ve caught their breath, the traders break out of the range – be it uptrend.
If traders decide that the initial trend was the right decision and continue to push the price in the same direction, the result is a continuation breakout. Just think of it as a “continuation” of the initial trend.
A reversal breakout, as the name suggests, reverses the previous trend in the opposite direction. In the beginning, it forms just like a continuation breakout, after the price consolidates after a big push in price.
Just like their brethren in continuation breakouts players also take a breather after locking horns with each other. However, there is a difference. The difference here is that the prevailing trend loses momentum after the players’ ability to sustain the trend begins to evaporate. consequently price is pushed in the opposite direction, resulting in a reversal breakout.
The only difference is that after this consolidation, forex traders decide that the trend is exhausted and push the price in the opposite or “reverse” direction.
As a result, you have what is called a “reversal breakout”.
A false breakout occurs when the price moves outside the consolidation range and closes outside but doesn’t continue in the direction of the breakout. Instead, the price moves back inside the consolidation range.
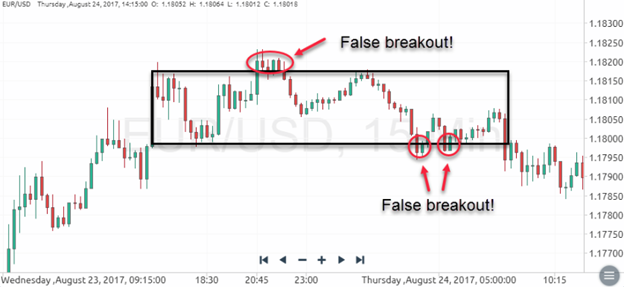
A good way to enter on a breakout is to wait until the price retraces back to the original breakout level and then wait to see if it bounces back to create a new high or low (depending on which direction you are trading).
Another way to combat fake outs is by not taking the first breakout you see.
By waiting to see if the price will continue to move in your intended direction, you give yourself a better chance of taking a profitable trade.
The downside to this is
that you may miss out on some trades in which the price moves quickly without
any hesitation.
Once you start getting used to the signs of breakouts, you’ll be able to spot good potential trades fairly quickly.
Chart Patterns can be well used: Double Top/Bottom; Head and Shoulders; Triple Top/Bottom
In addition to chart patterns, there are several tools and indicators you can use to supplement your case for a reversal breakout.
Beside trading breakouts out of consolidation phases, you can also use trendlines and channels to trade breakouts. By now, you already know what trendlines and channels are. When the price makes higher lows or lower highs, you can connect those price swings with a trendline and wait for the price to break out above or below the trendline. The following chart shows how to use trendlines when trading breakouts.
*The information presented above is intended for informative and educational purposes, should not be considered as investment advice, or an offer or solicitation for a transaction in any financial instrument and thus should not be treated as such. Past performance is not a reliable indicator of future results.

Cairo Investment Expo 2021
Ultimate FinTech Awards 2022
European Fintech 2022
2023 Global Forex Awards
Cairo Investment Expo 2021
Ultimate FinTech Awards 2022
European Fintech 2022
2023 Global Forex Awards
Online Chat Chat with us
Email:supportsohomarkets.com
著作権 © 2024 - 無断複写・転載を禁じます。
Soho Markets LLC は、国際事業会社としてセントビンセントおよびグレナディーン諸島に設立されており、登録番号は
1310 LLC 2021 です。
リスク警告: CFD は複雑な商品であり、レバレッジにより急速に資金を失う高いリスクが伴います。
CFD の仕組みを理解しているかどうか、また、お金を失う高いリスクを冒す余裕があるかどうかを検討する必要があります。
リスク開示の全文をお読みください。
地域制限: SOHO MARKETS GLOBAL LIMITED は、アメリカ合衆国、カナダ、イスラエル、日本、北朝鮮、ベルギー、および国連/EU
制裁対象国の領土ではサービスを提供しません。
Soho Markets Global Limited および
Soho Markets LLC は、EU の顧客にサービスを提供しません。
EU の顧客には Vstar & Soho Markets Ltd のみがサービスを提供できます。