V&Sグループの一員
A forex pivot point is an indicator developed by floor traders in the commodities markets to determine potential turning points, also known as "pivots." Forex pivot points are calculated to determine levels in which the sentiment of the market could change from "bullish" to "bearish". Currency traders see pivot points as markers of support and resistance.
Day traders will use pivot points as a way to determine when market sentiment has gone from bullish to bearish or vice versa. If the market breaks this level to the upside, then the sentiment is said to be positive for that day and it is likely to continue its way up. On the other hand, if the price slips under this level, then the sentiment is considered negative, and it is expected to continue its depreciation.
Pivot Points are also expected to provide some kind of support or resistance, and if price can't break any of the associated R or S levels, a possible bounce from it is plausible. Since the Forex is a 24hr market there is an eternal debate on deciding at which time the open, the close, the high and the low from each 24-hour cycle should be taken. Nevertheless, the majority of traders agree that the most accurate predictions are achieved when the pivot point is adjusted to the GMT or the Eastern (New York - EST) times.Here is an example of pivot points plotted on a 6 day EUR/USD chart:
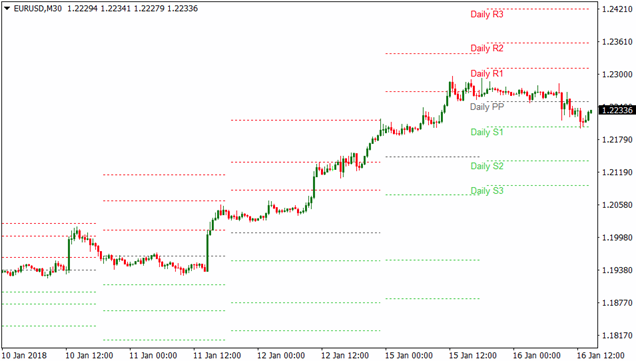
As you can see here, horizontal support and resistance levels are placed on your chart.
The pivot point and associated support and resistance levels are calculated by using the last trading session’s open, high, low, and close.
Since forex is a 24-hour market, most forex traders use the New York closing time of 4:00pm EST as the previous day’s close.
Pivot point (PP) = (High + Low + Close) / 3
Support and resistance levels are then calculated off the pivot point like so:
1. First resistance (R1) = (2 x PP) – Low
2. First support (S1) = (2 x PP) – High
3. Second resistance (R2) = PP + (High – Low)
4. Second support (S2) = PP – (High – Low)
5. Third resistance (R3) = High + 2(PP – Low)
6. Third support (S3) = Low – 2(High – PP)
The simplest way to use pivot point levels in your forex trading is to use them just like your regular support and resistance levels. The more times a currency pair touches a pivot level then reverses, the stronger the level is. If price is nearing a support level, you could BUY and put your stop just below the level. Here’s a 15-minute chart of GBP/USD.
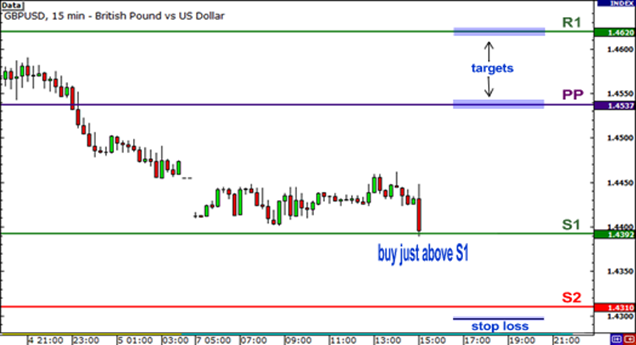
In the chart above, you see that price is testing the S1 support level. If you think it will hold, what you can do is buy at market and then put a stop loss order past the next support level.
If you’re conservative, you can set a wide stop just below S2. If price reaches past S2, chances are it won’t be coming back up, as both S1 and S2 could become resistance levels. If you’re a little more aggressive and confident that support at S1 would hold, you can set your stop just below S1. As for your take profit points, you could target PP or R1, which could also provide some sort of resistance. Let’s see what happened if you bought at market.
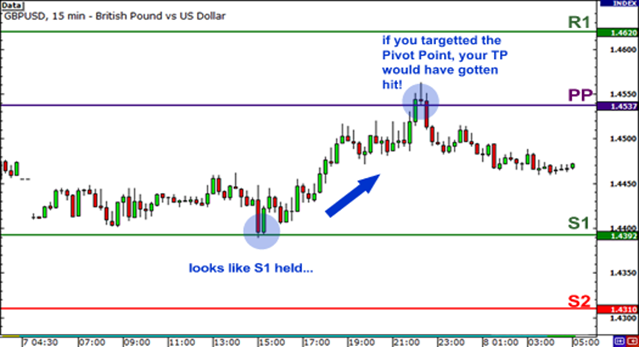
Most of the time, trading normally takes place between the first support and resistance levels.
Occasionally, price will test the second levels and every once in a while, the third levels will be tested.
While price may spend the majority of its time reversing between lines of support and resistance, there will also be periods of volatility when price breaks out. A price breakout simply refers to the price of a traded asset moving through a pre-designated area of either support or resistance. Savvy traders can then prepare to look for these opportunities by finding these values on their graph.
Before you can trade a breakout, you will first need to identify existing points of support and resistance. While there are many tools available for finding these areas, traders may again choose to use the previously discussed Camarilla pivot points. When added to the graph, these pivots will allow traders to spot a breakout using the R4 and S4 lines now available on their graph. Now traders can consider a series of options for trading. The easiest way to trade breakouts is through the use of a series of order entries. Entry orders set above resistance will be waiting to buy the market in the event price moves to higher highs. Conversely, orders to sell below the S4 line of support will be triggered upon the market moving to lower lows. Traders that would like more confirmation may also consider waiting for a candle close, then triggering a market order. The key is to get into the market on a new surge in price, which generally transpires along with an economic announcement.
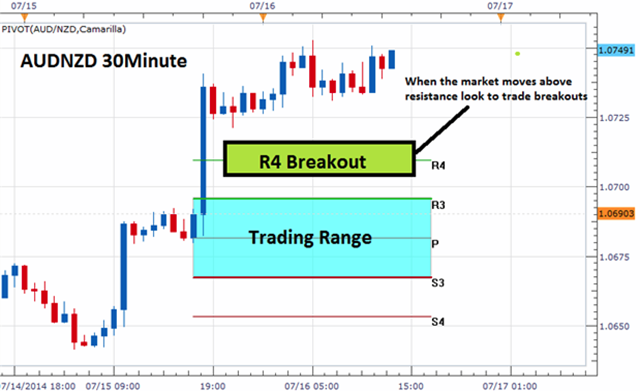
As with any trading strategy, traders should spend as much time planning their exits as they do their entry orders. Through the use of Camarilla Pivots, traders again can develop a very systematic methodology for exiting the market. Since the market is breaking out, risk can be managed by placing stop orders inside of the designated trading range. The rationale behind this is that if market conditions change, traders should close their positions and look for other opportunities.
Once a stop is found, traders can then set a profit target. Since our pivot points are calculated using a fraction of the previous day’s trading range, we can again use the designated values for profit targets. Traders can look for a minimum of 1 times the denoted range, which in the example of the AUDNZD above would be 28 pips. This would equate to a 1:2 risk reward ratio when used with a standardized stop.
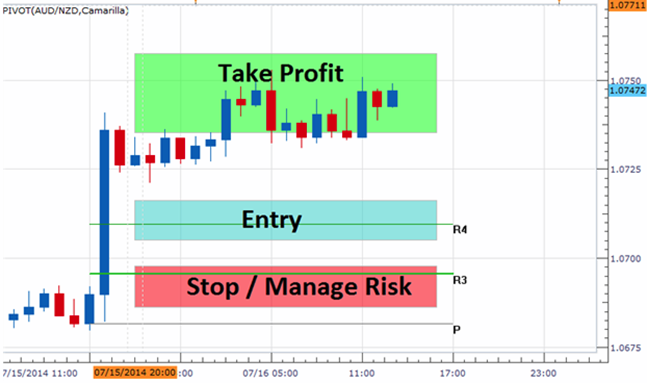
The Role Reversal is a common price pattern that is found on 99.9% of the charts you look at. Once you become familiar with this pattern you will be able to use it to determining your entry and exit points, on just about any trade you do. Remember that, when support levels break, they usually turn into resistance levels. This concept of “role reversal” also applies for broken resistance levels which become support levels. One of the most interesting phenomena regarding support and resistance occurs when the price of the underlying asset is finally able to break out and go beyond an identified support or resistance level. When this happens, it is not uncommon to see a previous level of support change its role and become a new area of short-term resistance. One of the difficult things about taking breakout trades is picking a spot to place your stop. Unlike range trading where you are looking for breaks of pivot point support and resistance levels, you are looking for strong fast moves.
Once a level breaks, in theory, that level will likely become “support-turned-resistance” or “resistance-turned-support.” Again, this is called a role reversal…since the roles have been reversed. If you were going long and price broke R1, you could place your stop just below R1. As for setting targets, you would typically aim for the next pivot point support or resistance level as your take profit point.
It’s very rare that price will break past all the pivot point levels, unless a big economic event or surprise news comes out.
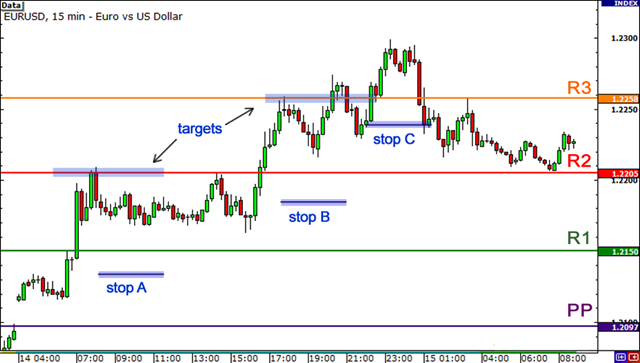
In this example, once you saw price break R1, you would have set your stop just below R1.
If you believed that price would continue to rise, you could keep your position and move your stop manually to see if move would continue.
There is one other way to incorporate pivot points into your forex trading strategy, and that’s to use it to gauge market sentiment. What this means is that you can tell whether traders are more inclined to buy or sell the pair. All you would need to do is to keep an eye on the pivot point.
If the price breaks through the pivot point to the top, it’s a sign that traders are bullish on the pair and you should start buying the pair. Here’s an example of what happened when the price stayed above the pivot point.
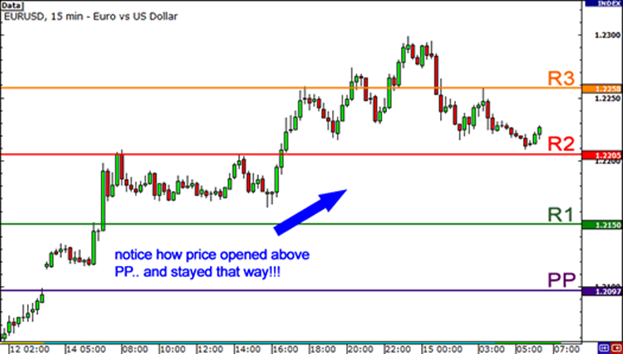
In this example, we see that EUR/USD gapped up and opened above the pivot point. The price then rose higher and higher, breaking through all the resistance levels. Now, if price breaks through the pivot point to the bottom, then you should start selling the pair. The price being below the pivot point would signal bearish sentiment and that sellers could have the upper hand for the trading session.
Let’s take a look at a chart of GBP/USD.
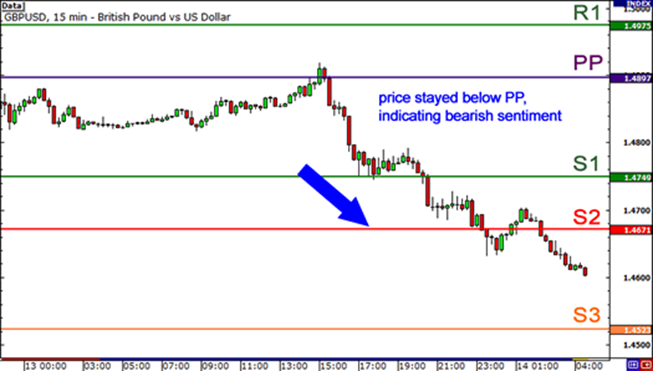
In the chart above, we see that the price tested the pivot point, which held as a resistance level.
There are times when you think that forex traders are bearish on a pair, only to see that the pair reverses and breaks through to the top!
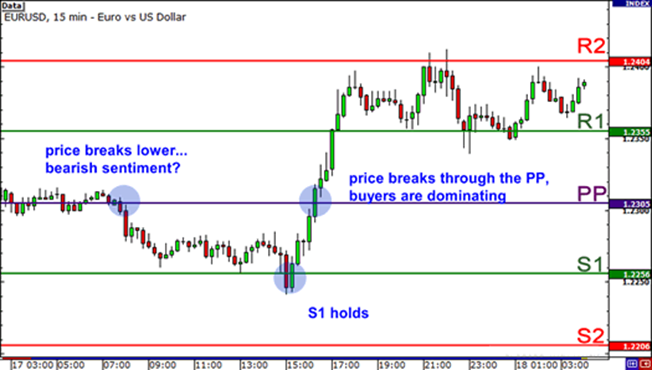
In this example, if you saw price breaking lower from the pivot point and sold. Later on, during the European session, EUR/USD popped higher, eventually breaking through the pivot point. What’s more, the pair stayed above the pivot point.
*The information presented above is intended for informative and educational purposes, should not be considered as investment advice, or an offer or solicitation for a transaction in any financial instrument and thus should not be treated as such. Past performance is not a reliable indicator of future results.

Cairo Investment Expo 2021
Ultimate FinTech Awards 2022
European Fintech 2022
2023 Global Forex Awards
Cairo Investment Expo 2021
Ultimate FinTech Awards 2022
European Fintech 2022
2023 Global Forex Awards
Online Chat Chat with us
Email:supportsohomarkets.com
著作権 © 2024 - 無断複写・転載を禁じます。
Soho Markets LLC は、国際事業会社としてセントビンセントおよびグレナディーン諸島に設立されており、登録番号は
1310 LLC 2021 です。
リスク警告: CFD は複雑な商品であり、レバレッジにより急速に資金を失う高いリスクが伴います。
CFD の仕組みを理解しているかどうか、また、お金を失う高いリスクを冒す余裕があるかどうかを検討する必要があります。
リスク開示の全文をお読みください。
地域制限: SOHO MARKETS GLOBAL LIMITED は、アメリカ合衆国、カナダ、イスラエル、日本、北朝鮮、ベルギー、および国連/EU
制裁対象国の領土ではサービスを提供しません。
Soho Markets Global Limited および
Soho Markets LLC は、EU の顧客にサービスを提供しません。
EU の顧客には Vstar & Soho Markets Ltd のみがサービスを提供できます。