
入金 方法


Harmonic price patterns take geometric price patterns to the next level by using Fibonacci numbers to define precise turning points. Unlike other common trading methods, Harmonic trading attempts to predict future movements. Let's look at some examples of how harmonic price patterns are used to trade currencies in the forex market. Harmonic trading combines patterns and math into a trading method that is precise and based on the premise that patterns repeat themselves. At the root of the methodology is the primary ratio, or some derivative of it (0.618 or 1.618). Complementing ratios include: 0.382, 0.50, 1.41, 2.0, 2.24, 2.618, 3.14 and 3.618. The primary ratio is found in almost all natural and environmental structures and events; it is also found in man-made structures. Since the pattern repeats throughout nature and within society, the ratio is also seen in the financial markets, which are affected by the environments and societies in which they trade. By finding patterns of varying lengths and magnitudes, the trader can then apply Fibonacci ratios to the patterns and try to predict future movements. The trading method is largely attributed to Scott Carney, although others have contributed or found patterns and levels that enhance performance. There are several Harmonic Price Patterns:
1. ABCD Pattern
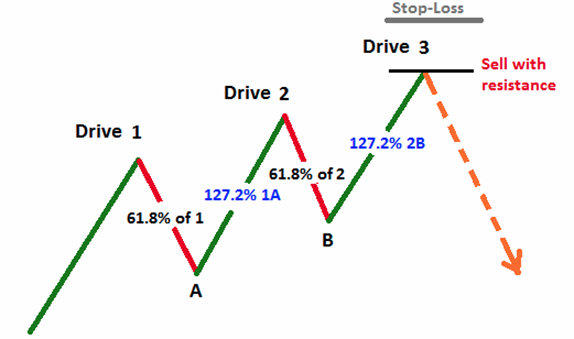
2. Three-Drive Pattern
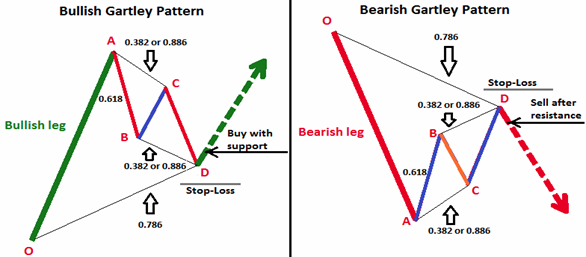
3. Gartley Pattern
4. Crab Pattern
5. Bat Pattern
6. Butterfly Pattern
Each pattern has both a bullish and bearish version. Bullish patterns help identify higher probability opportunities to buy or go "long." Bearish patterns help signal opportunities to "short," or sell.
Each turning point (A, B, C, and D) represents a significant high or significant low on a price chart. These points define three consecutive price swings, or trends, which make up each of the three pattern "legs." These are referred to as the AB leg, the BC leg, and the CD leg.
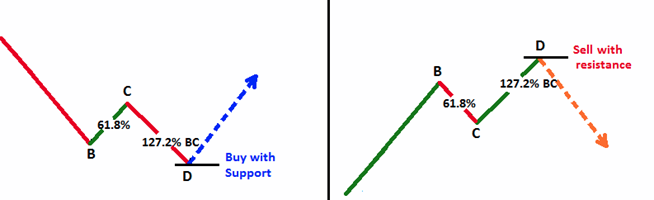
Also the length of line AB should be equal to the length of line CD. The time it takes for the price to go from A to B should be equal to the time it takes for the price to move from C to D.
The Three-Drives pattern has its origins in Elliotology and was referred by Robert Prechter in his famous book, “Elliott Wave Principle.” The Three Drive pattern is really an offshoot of the wave structures that typified price movements and were detailed in the Wave Principle. It can be described in brief as a five-wave structure that follows the Fibonacci rules for projecting retracements and extensions within its formation.
Like the ABCD, this pattern too appears in a bearish or bullish mode. The bearish pattern is a rising five-wave structure of which point A is a Fibonacci 61.8% retracement of leg (or, drive) 1. Thereafter, drive 2 is a 127.2% extension of the corrective move ending at A. Drive 2 also sees a corrective 61.8% retracement to point B. Drive 3 is the 127.2% extension of the corrective move ending at B. Traders gear up for the anticipated short trade when resistance comes up during the third drive, marking an end of that.
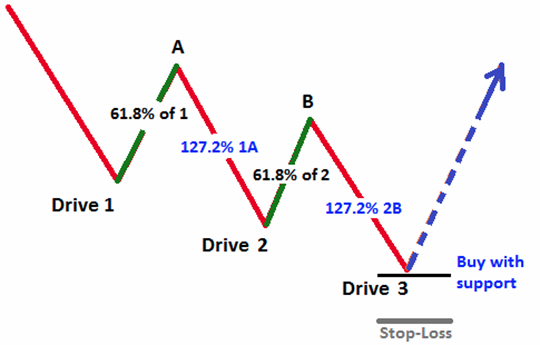
The bullish pattern is a falling five-wave structure of which point A is a Fibonacci 61.8% retracement of leg (or, drive) 1. Thereafter, drive 2 is a 127.2% extension of the corrective move ending at A. Drive 2 also sees a corrective 61.8% retracement to point B. Drive 3 is the 127.2% extension from point B, and is the recommended buying point. Traders gear up for the anticipated long trade as soon as support is realized in the course of the third drive, marking the end of that drive.
H.M. Gartley introduced Gartley patterns in his book "Profits in Stock Markets". This pattern is also called Gartley 222 patterns as it was described on the page # 222 of the mentioned book. Gartley pattern is basically an ABCD pattern appearing during a bullish or bearish trend and it indicates the possibilities that the correction of the ongoing trend may be over and the initial trend may resume.
In simple words the Gartley patterns can be summarized as follows:
1. Bullish Gartley pattern = Bullish leg during a bullish trend + Variation of Bullish ABCD patterns.
2. Bearish Gartley pattern = Bearish leg during a bullish trend + Variation of Bearish ABCD patterns.
A standard ABCD pattern has 0.618 Fibonacci retracement followed by a 1.272 extension, while the harmonic pattern in the Gartley patterns consists of a retracement of either 0.382 or 0.886 followed by an extension of either 1.272 or 1.618 levels. Also the harmonic pattern ends at a retracement of 0.786 from the point where the overall pattern begins.
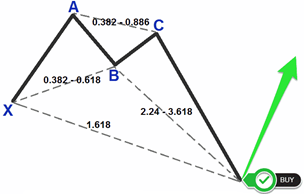
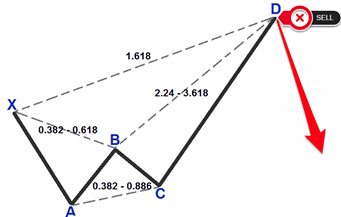
The Harmonic Crab pattern or The Crab Pattern™ was discovered in 2001. As with all harmonic patterns, the Crab pattern is a reversal pattern. Therefore, we have the bearish Crab pattern that signals a bearish reversal in price and a bullish Crab pattern that signals a bullish reversal in price.
Starting with the swing high or low, each leg is marked by a letter. There is a total of five swing points named as X, A, B, C and D. In some harmonic patterns, you will only find four, namely the X, A, B and C. The Crab pattern is distinct due to its sharp movement in the CD leg. This is usually a 1.618% Fibonacci retracement of the XA leg, the initial part of the Crab pattern.
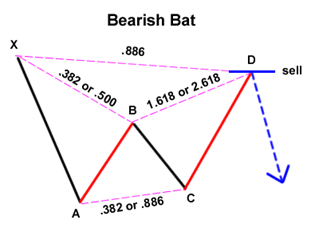
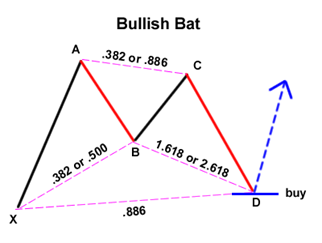
The Bat pattern is similar to the Gartley pattern in that it is a retracement and continuation pattern that occurs when a trend temporarily reverses its direction but then continues on its original course. It gives you the opportunity to enter the market at a good price, just as the pattern ends and the trend resumes. The Bat is defined by the .886 retracement of move XA as Potential Reversal Zone. The Bat pattern has the following qualities:
1. Move AB should be the .382 or .500 retracement of move XA.
2. Move BC can be either .382 or .886 retracement of move AB.
If the retracement of move BC is .382 of move AB, then CD should be 1.618 extension of move BC. Consequently, if move BC is .886 of move AB, then CD should be 2.618 extension of move BC.
CD should be .886 retracement of move XA.
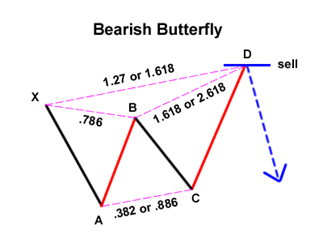
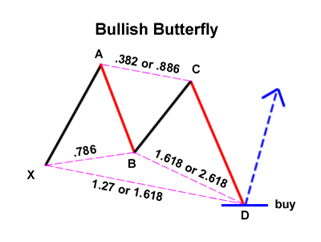
The Butterfly pattern is a reversal pattern composed of four legs, similar to the Gartley and Bat pattern, marked X-A, A-B, B-C and C-D.
It helps you identify when a current price move is likely approaching its end. This means you can enter the market as the price reverses direction. There is a bullish version where you place a buy trade and a bearish version where you would place a sell trade.
The perfect Butterfly pattern is defined by the .786 retracement of move AB with respect to move XA. The Butterfly contains these specific characteristics:
Move AB should be the .786 retracement of move XA.
Move BC can be either .382 or .886 retracement of move AB.
If the retracement of move BC is .382 of move AB, then CD should be 1.618 extension of move BC. Consequently, if move BC is .886 of move AB, then CD should extend 2.618 of move BC.
CD should be 1.27 or 1.618 extension of move XA.
*The information presented above is intended for informative and educational purposes, should not be considered as investment advice, or an offer or solicitation for a transaction in any financial instrument and thus should not be treated as such. Past performance is not a reliable indicator of future results.

Cairo Investment Expo 2021
Ultimate FinTech Awards 2022
European Fintech 2022
2023 Global Forex Awards
Cairo Investment Expo 2021
Ultimate FinTech Awards 2022
European Fintech 2022
2023 Global Forex Awards
Online Chat Chat with us
Email:supportsohomarkets.com
著作権 © 2024 - 無断複写・転載を禁じます。
Soho Markets LLC は、国際事業会社としてセントビンセントおよびグレナディーン諸島に設立されており、登録番号は
1310 LLC 2021 です。
リスク警告: CFD は複雑な商品であり、レバレッジにより急速に資金を失う高いリスクが伴います。
CFD の仕組みを理解しているかどうか、また、お金を失う高いリスクを冒す余裕があるかどうかを検討する必要があります。
リスク開示の全文をお読みください。
地域制限: SOHO MARKETS GLOBAL LIMITED は、アメリカ合衆国、カナダ、イスラエル、日本、北朝鮮、ベルギー、および国連/EU
制裁対象国の領土ではサービスを提供しません。
Soho Markets Global Limited および
Soho Markets LLC は、EU の顧客にサービスを提供しません。
EU の顧客には Vstar & Soho Markets Ltd のみがサービスを提供できます。