
入金 方法


The first way to spot a possible breakout is to draw trend lines on a chart.
To draw a trend line, you simply look at a chart and draw a line that goes with the current trend.
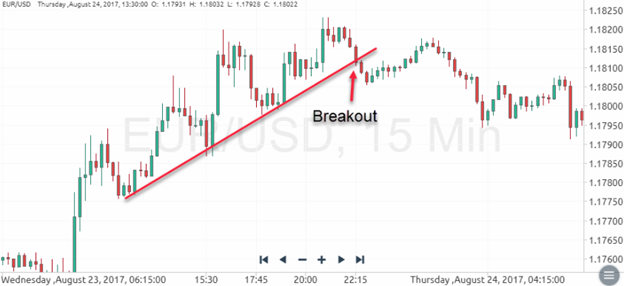
When drawing trend lines it is best if you can connect at least two tops or bottoms together. The more tops or bottoms that connect, the stronger the trend line.
So how can you use trend lines to your advantage? When the price approaches your trend line, only two things can happen.
The price could either bounce off the trend line and continue the trend.
The price could breakout through the trend line and cause a reversal.
We want to take advantage of that breakout!
Looking at the price is not enough however. This is where using one or more of the indicators mentioned earlier in this lesson could help you tremendously.
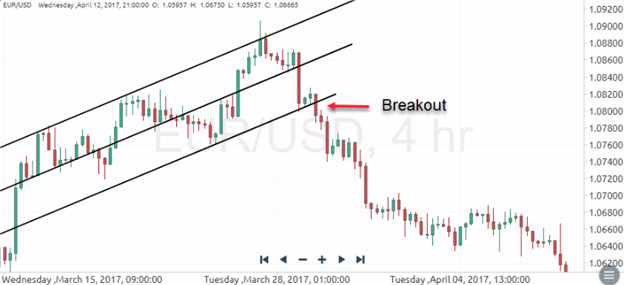
Another way to spot breakout opportunities is to draw trend channels.
Drawing trend channels are almost the same as drawing trend lines except that after you draw a trend line you have to add the other side.
Channels are useful because you can spot breakouts on either direction of the trend.
The approach is similar to how we approach trend lines in that we wait for the price to reach one of the channel lines and look at the indicators to help us make our decision.
When the price bounces off the upper and lower channel trendline, it’s only a matter of time when a breakout will occur. After the price breaks the channel, wait for the candlestick to close and enter a position in the direction of the breakout. The following chart shows how to trade a short position after the price breaks out of a channel.
The third way you can spot breakout opportunities is by looking for triangles.
Triangles are formed when the market price starts off volatile and begins to consolidate into a tight range.
Our goal is to position ourselves when the market consolidates so that we can capture a move when a breakout occurs.
There are 3 types of triangles: Ascending triangle; Descending triangle; Symmetrical triangle
Ascending triangles form when there is a resistance level and the market price continues to make higher lows.
It is easily recognized by a rising trend line intersecting with a flat resistance line. It is often regarded by traders as a bullish pattern characterized by a breaking out above resistance when completed. However, in the ascending triangle pattern, breakouts can take place below resistance. This can especially be the case when the trend prior to the triangle was down.
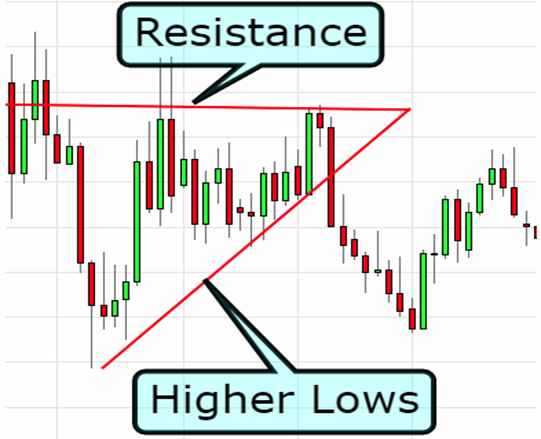
The story behind an ascending triangle is that each time the price reaches a certain high, there are several traders who are convinced about selling at that level, resulting in the price dropping back down.
On the other side, there are several traders who believe the price should be higher, and as the price begins to drop, buy higher than its previous low.
The result is a struggle between the bulls and bears which ultimately converges into an ultimate showdown…
What we are looking for is a breakout to the upside since ascending triangles are generally bullish signals. When we see a breach of the resistance level the proper decision would be to go long.
Descending triangles are basically the opposite of ascending triangles.
The triangle pattern represents the forces of buyers unable to push price higher and sellers struggling to push price lower. Usually, the struggle is resolved with a breakout below support
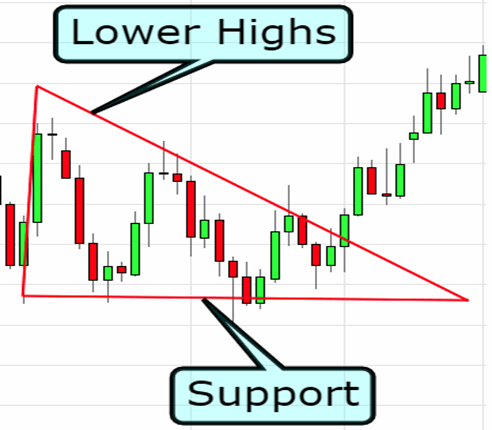
Descending triangles are generally bearish signals. To take advantage of this, our goal is to position ourselves to go short if the price should breakout below the support level.
The third type of triangle is the symmetrical triangle.
Rather than having a horizontal support or resistance level, both the bulls and the bears create higher lows and lower highs and form an apex somewhere in the middle.
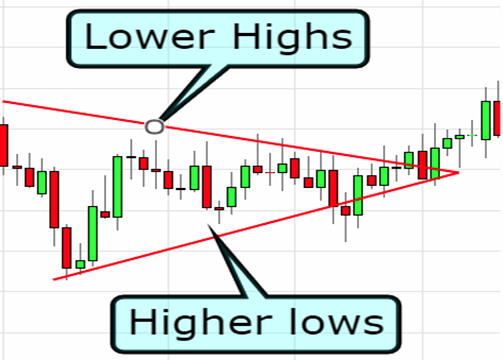
Unlike the ascending and descending triangles which are generally bullish and bearish signals, symmetrical triangles have NO directional bias.
This coiling of price between support and resistance is called a consolidation. Usually, within the first 2/3 of the triangle, a breakout occurs either above trendline resistance or below trendline support as either the sellers or buyers take control.
Once a triangle is identified on the chart, traders will wait for a breakout either above the resistance trendline or below support. After a breakout is confirmed with either a closed candle above resistance or below support a stop is placed approximately 10 pips below the last swing low of the triangle. A limit equal to the height of the triangle is then placed.
In the case of the symmetrical triangle, you want to position yourself to be ready for both an upside or downside breakout. A perfect time to use the one-cancels-the-other (OCO) order!
Ascending triangles usually breakout to the upside.
Descending triangles usually breakout to the downside.
Symmetrical triangles can break either to the upside or the downside.
*The information presented above is intended for informative and educational purposes, should not be considered as investment advice, or an offer or solicitation for a transaction in any financial instrument and thus should not be treated as such. Past performance is not a reliable indicator of future results.

Cairo Investment Expo 2021
Ultimate FinTech Awards 2022
European Fintech 2022
2023 Global Forex Awards
Cairo Investment Expo 2021
Ultimate FinTech Awards 2022
European Fintech 2022
2023 Global Forex Awards
Online Chat Chat with us
Email:supportsohomarkets.com
著作権 © 2024 - 無断複写・転載を禁じます。
Soho Markets LLC は、国際事業会社としてセントビンセントおよびグレナディーン諸島に設立されており、登録番号は
1310 LLC 2021 です。
リスク警告: CFD は複雑な商品であり、レバレッジにより急速に資金を失う高いリスクが伴います。
CFD の仕組みを理解しているかどうか、また、お金を失う高いリスクを冒す余裕があるかどうかを検討する必要があります。
リスク開示の全文をお読みください。
地域制限: SOHO MARKETS GLOBAL LIMITED は、アメリカ合衆国、カナダ、イスラエル、日本、北朝鮮、ベルギー、および国連/EU
制裁対象国の領土ではサービスを提供しません。
Soho Markets Global Limited および
Soho Markets LLC は、EU の顧客にサービスを提供しません。
EU の顧客には Vstar & Soho Markets Ltd のみがサービスを提供できます。