
入金 方法


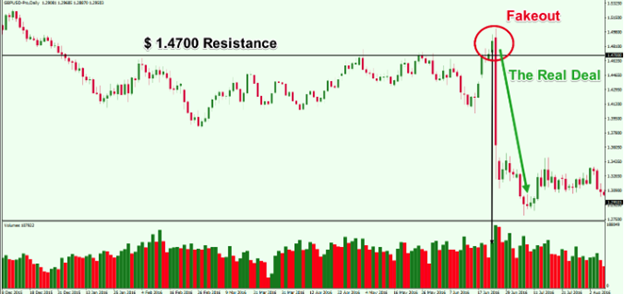
For us to detect a fakeout we need to first identify a breakout. A fakeout is simply a failed breakout. Just like breakouts, fakeouts also normally occur on support and resistance levels, trendlines, Fibonacci retracements, channels and chart patterns.
Breakouts are popular among forex traders.
When price finally “breaks” out of that support or resistance level, one would expect price to keep moving in the same direction of the break.
Below you will find an example illustrating a false breakout and reversal.
The magenta line is the Neckline of the pattern, and considered the signal line.
In the red circle we see an upside breakout through the Neckline of the pattern. This provides confirmation for the Inverted Head and Shoulders pattern and creates a strong bullish potential on the chart. However, we see that the price action quickly rejects this bullish breakout.
The price reverses sharply and creates a bearish move that is approximately equal to the size of the Inverted H&S pattern. Therefore, we say that the breakout in the red circle was a false breakout, also known as a fakeout.
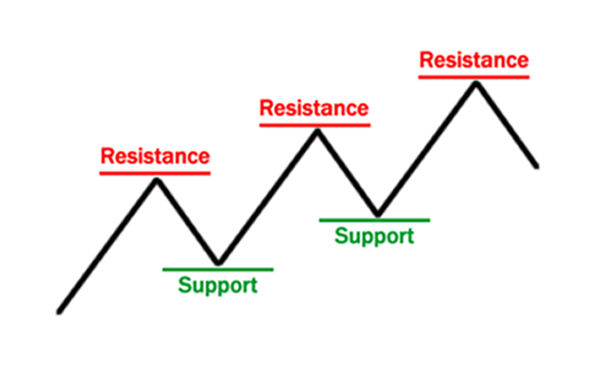
One thing you should remember to note about support and resistance levels is that they are areas in which a predictable price response can be expected.
Support and resistance levels provide forex traders with a valuable tool they can use in their trading. By learning about these levels, investors can obtain a better understanding of what is going on in the markets.
In their most basic sense, support levels denote prices that a currency will not likely fall below, while resistance levels indicate prices the currency will probably not exceed. If a currency has difficulty falling below a certain price, it has reached a support level. Generally, this happens because a currency's drop in value has resulted in there being more buyers than sellers. At this point, traders sweep in and make purchases, creating a floor.
Alternatively, when a currency encounters difficulty rising above a specific value, it has hit resistance. This usually occurs because the number of sellers outweighs the number of buyers after a currency has experienced a sharp increase in price.
By analyzing these key levels, investors can more accurately predict whether a current trend will keep going or, alternatively, reverse. Armed with this information, a trader can potentially find a price point to enter a position, or close a position, and place a stop or a limit.
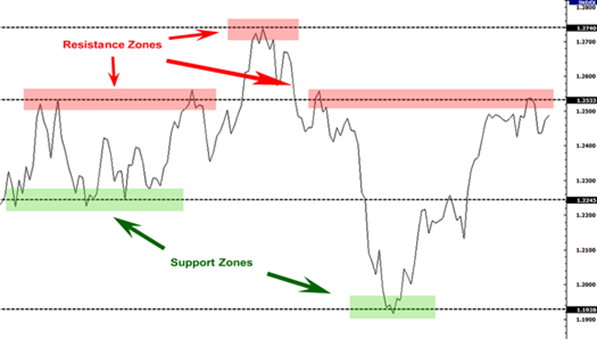
Support levels are areas where buying pressure is just enough to overcome selling pressure and halt or reverse a downtrend.
A strong support level is more likely to hold up even if price breaks the support level and it provides traders a good buying opportunity.
Resistance levels are just like support levels but work in the opposite way. They tend to halt or even reverse uptrends.
Resistance levels are areas in which selling pressure is just enough to overcome buying pressure and force price back down.
Strong resistance levels are more like to hold up even if price temporarily breaks the resistance level and it provides traders a good selling opportunity.
Fading breakouts simply means trading in the opposite direction of the breakout.
Fading breakouts = trading FALSE breakouts.
You would fade a breakout if you believe that a breakout from a support or resistance level is false and unable to keep moving in the same direction.
In cases in which the support or resistance level broken is significant, fading breakouts may prove to be smarter than trading the breakout.
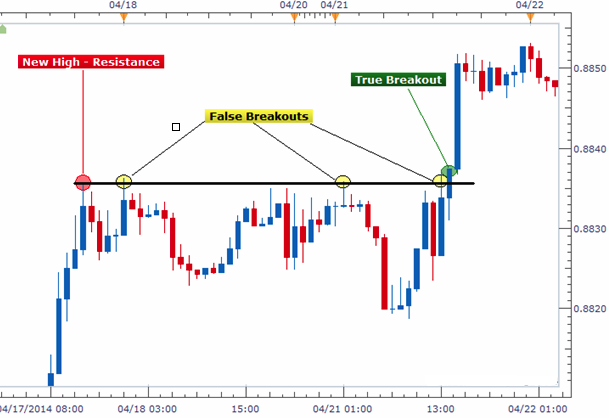
Keep in mind that fading breakouts is a great short-term strategy. Breakouts tend to fail at the first few attempts but may succeed eventually.
Support and resistance levels are supposed to be price floors and ceilings. If these levels are broken, one would expect for price to continue in the same direction as the breakage.
If a support level is broken, that means that the general price movement is downwards, and people are more likely to sell than buy.
Conversely, if a resistance level is broken, then the crowd believes that price is more likely to rally even higher and will tend to buy rather than sell.
Retail traders like to trade breakouts.
The smart minority, the institutional, more seasoned traders, prefer to fade breakouts.
The smarter forex traders take advantage of the collective thinking of the crowd or inexperienced traders and win at their expense.
That is why trading alongside the more experienced forex traders could be very profitable as well.
In order to fade breakouts, you need to know where potential fakeouts can occur.
Potential fakeouts are usually found at support and resistance levels created through trend lines, chart patterns, or previous daily highs or lows.
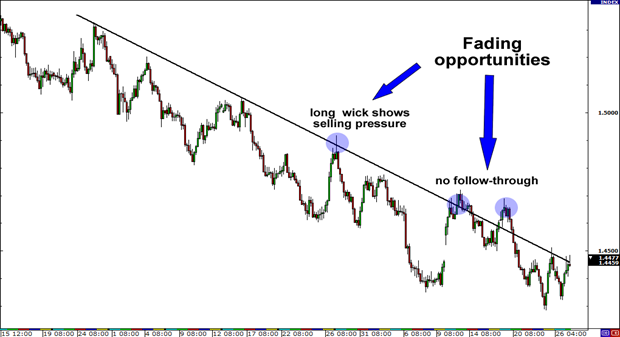
In fading breakouts, always remember that there should be SPACE between the trend line and price.
If there is a gap between the trend line and price, it means price is heading more in the direction of the trend and away from the trend line.
Like in the example below, having space between the trend line and price allows price to retrace back towards the trend line, perhaps even breaking it, and provide fading opportunities.
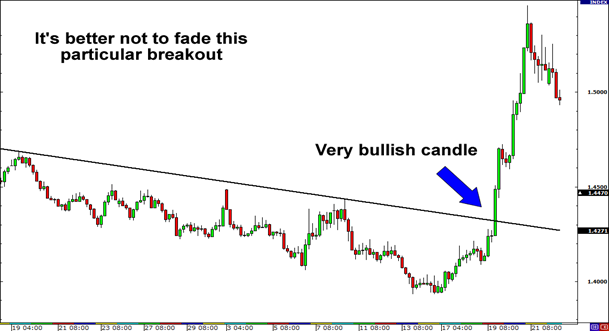
The SPEED of price movement is also very important.
If price is moving slowly towards the trend line, a false breakout may be likely.
However, a fast price movement towards the trend line could prove to be a successful breakout. With a high price movement speed, momentum can carry price past the trend line and beyond. In this situation, it is better to step back from fading the breakout.
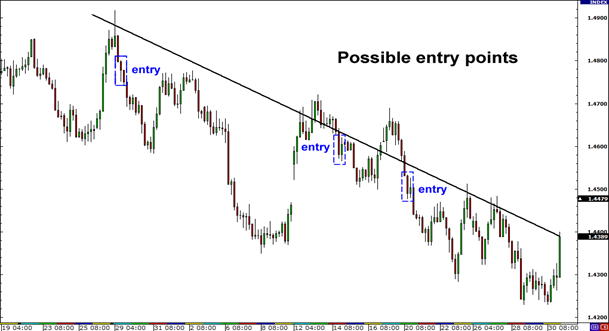
Using the first chart example, let’s point out possible entry points by zooming in a little.
*The information presented above is intended for informative and educational purposes, should not be considered as investment advice, or an offer or solicitation for a transaction in any financial instrument and thus should not be treated as such. Past performance is not a reliable indicator of future results.

Cairo Investment Expo 2021
Ultimate FinTech Awards 2022
European Fintech 2022
2023 Global Forex Awards
Cairo Investment Expo 2021
Ultimate FinTech Awards 2022
European Fintech 2022
2023 Global Forex Awards
Online Chat Chat with us
Email:supportsohomarkets.com
著作権 © 2024 - 無断複写・転載を禁じます。
Soho Markets LLC は、国際事業会社としてセントビンセントおよびグレナディーン諸島に設立されており、登録番号は
1310 LLC 2021 です。
リスク警告: CFD は複雑な商品であり、レバレッジにより急速に資金を失う高いリスクが伴います。
CFD の仕組みを理解しているかどうか、また、お金を失う高いリスクを冒す余裕があるかどうかを検討する必要があります。
リスク開示の全文をお読みください。
地域制限: SOHO MARKETS GLOBAL LIMITED は、アメリカ合衆国、カナダ、イスラエル、日本、北朝鮮、ベルギー、および国連/EU
制裁対象国の領土ではサービスを提供しません。
Soho Markets Global Limited および
Soho Markets LLC は、EU の顧客にサービスを提供しません。
EU の顧客には Vstar & Soho Markets Ltd のみがサービスを提供できます。