Bagian dari Grup V&S
-
Jual beli
Platform Perdagangan
Jenis akun
Persyaratan Margin
- Sumber Daya Perdagangan
- Layanan Kelembagaan
- Tentang
1. Technical Analysis
2. Fundamental Analysis
3. Sentiment Analysis
Forex technical analysis involves looking at patterns in price history to determine the higher probability time and place to enter a trade and exit a trade. As a result, technical analysis in forex is one of the most widely used types of analysis.
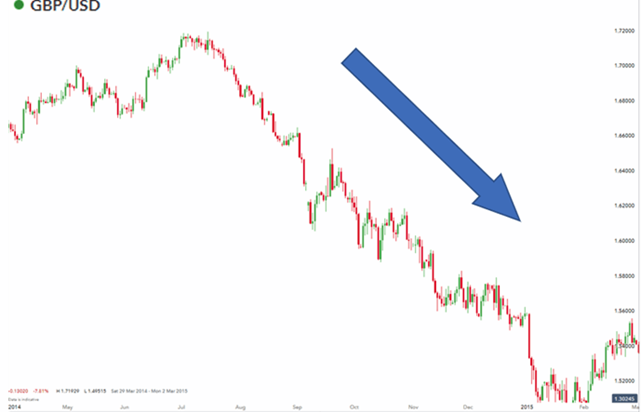
Since FX is one of the largest and most liquid markets, the movements on a chart from the price action generally gives clues about hidden levels of supply and demand. Other patterned behavior such as which currencies are trending the strongest can be obtained by reviewing the price chart. An example of this can be seen below in the GBP/USD chart where the US dollar is strengthening against the Pound Sterling.

Trend lines are probably the most common form of technical analysis in forex trading. A trendline is a line drawn over pivot highs or under pivot lows to show the prevailing direction of price. Trendlines are a visual representation of support and resistance in any time frame. They show direction and speed of price, and also describe patterns during periods of price contraction.

There are three types of trends:
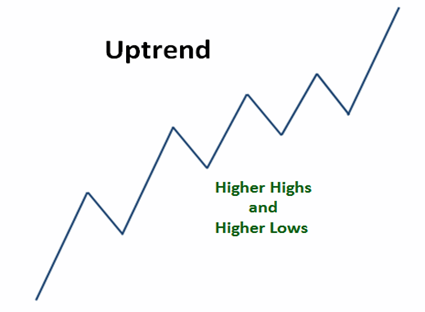
1. Uptrend (higher lows)
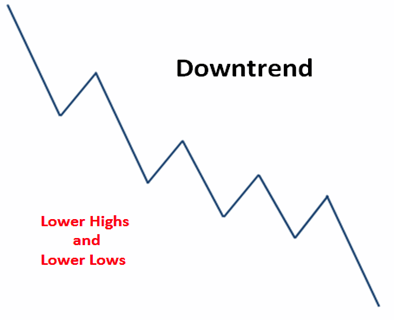
2. Downtrend (lower highs)
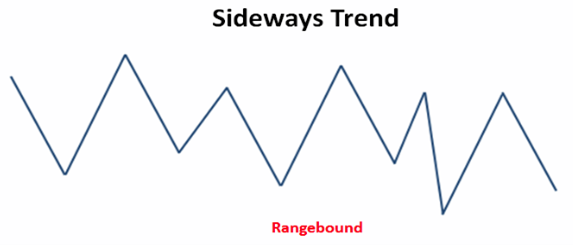
3. Sideways trends (ranging)
An uptrend describes the price movement of a financial asset when the overall direction is upward. In an uptrend, each successive peak and trough is higher than the ones found earlier in the trend. The uptrend is therefore composed of higher swing lows and higher swing highs. As long as the price is making these higher swing lows and higher swing highs, the uptrend is considered intact. Once the price starts making lower swing highs or lower swing lows, the uptrend is in question or has reversed into a downtrend.
Some traders and investors only choose to trade during uptrends. These trend traders utilize various strategies to take advantage of the tendency for the price to make higher highs and higher lows.
An uptrend provides investors with an opportunity to profit from rising asset prices. Selling an asset once it has failed to create a higher peak and trough is one of the most effective ways to avoid large losses that can result from a change in trend. Some technical traders utilize trendlines to identify an uptrend and spot possible trend reversals. The trendline is drawn along the rising swing lows, which helps show where future swing lows may form.
Moving averages are also utilized by some technical traders to analyze uptrends. When the price is above the moving average the trend is considered up, but when the price drops below moving average it means the price is now trading below the average price over a given period and may therefore no longer be in an uptrend. While these tools may be helpful in visually seeing the uptrend, ultimately the price should be making higher swing highs and higher swing lows to confirm that an uptrend is present. When an asset fails to produce higher swing highs and lows, it means that a downtrend could be underway, the asset is ranging, or the price action is choppy and the trend direction is hard to determine. In such cases, uptrend traders may opt to step aside until an uptrend is clearly visible.

A downtrend occurs when the price of an asset moves lower over a period of time. While the price may move intermittently higher or lower, downtrends are characterized by lower peaks and lower troughs over time. Notice how each successive peak and trough is lower than the previous one. For example, the low at Point 3 is lower than the low at Point 1. The downtrend will be deemed broken once the price closes above the high at Point 4.
An uptrend is the opposite of a downtrend, while markets that are moving sideways are known as ranging or range-bound markets. Many traders seek to avoid downtrends because they can adversely affect the value of any investment. A downtrend can last for minutes, days, weeks, months, or even years, so identifying a downtrend early is very important. Once a downtrend has been established (series of lower peaks) a trader should be very cautious about entering into any new long positions.
Short sellers seek to profit from downtrends by borrowing and then immediately selling shares with the agreement to repurchase them in the future. These are known as short positions or short selling. If the asset's price continues to decline, the trader profits from the difference between the immediate sale price and the lower future repurchase price. Often times, traders use technical indicators and chart patterns to identify and confirm downtrends. Moving averages, for example, can be used to identify the overall trend. If the price is lower than a moving average, the stock is likely to be in a downtrend, and vice versa for an uptrend. Momentum indicators, such as the relative strength index (RSI), can also show the magnitude or strength of the downtrend at a given point in time, which can help when deciding whether or not to enter a short position.

A sideways trend is the horizontal price movement that occurs when the forces of supply and demand are nearly equal. This typically occurs during a period of consolidation before the price continues a prior trend or reverses into a new trend.
A sideways price trend is also commonly known as a "horizontal trend." Sideways trends are generally the result of a price traveling between strong levels of support and resistance. It is not uncommon to see a horizontal trend dominate the price action of a specific asset for a prolonged period before starting a new trend higher or lower. These periods of consolidation are often needed during prolonged trends, as it is nearly impossible for such large price moves to sustain themselves over the longer term.
Volume, which is an important trading indicator, mostly remains flat during a sideways trend because it is equally balanced between bulls and bears. It shoots up (or down) sharply in one direction, when a breakout (or breakdown) is expected to occur. When analyzing sideways trends, traders should look at other technical indicators and chart patterns to provide an indicator of where the price may be headed and when a breakout or breakdown may be likely to occur.

Fundamental analysis is a way of looking at the forex market by analyzing economic, social, and political forces that may affect the supply and demand of an asset. Using supply and demand as an indicator of where price could be headed is easy.
The better shape a country’s economy is, the more foreign businesses and investors will invest in that country. Fundamental analysis is the process of looking at a business at the most basic or fundamental financial level. This type of analysis examines the key ratios of a business to determine its financial health. Fundamental analysis can also give you an idea of the value of what a company's stock should be. It takes several factors into account, including revenue, asset management, and the production of a business as well as interest rate.
Many investors use fundamental analysis
alone, but it can be particularly helpful to use it in combination with other
tools to evaluate stocks for investment purposes. The goal is to determine the
current worth of the stock, and, perhaps more importantly, to identify how the
market values the stock. Even if you don't plan to do an in-depth fundamental
analysis yourself, understanding the key ratios and terms can help you follow
stocks more closely and accurately.
For example, let’s say that the U.S. dollar has been gaining strength because
the U.S. economy is improving. As the economy gets better, raising interest
rates may be needed to control growth and inflation. Higher interest
rates make dollar-denominated financial assets more attractive. As a
result, the value of the dollar will likely increase.
Each trader has his or her own opinion of why the market is acting the way it does and whether to trade in the same direction of the market or against it. The market basically represents what all traders feel about the market. Each trader’s thoughts and opinions, which are expressed through whatever position they take, helps form the overall sentiment of the market regardless of what information is out there.
The problem is that as retail traders, no matter how strongly you feel about a certain trade, you can’t move the forex markets in your favor. Sentiment Analysis also known as Opinion Mining is a field within Natural Language Processing (NLP) that builds systems that try to identify and extract opinions within text. Usually, besides identifying the opinion, these systems extract attributes of the expression e.g.:
1. Polarity: if the speaker expresses a positive or negative opinion,
2. Subject: the thing that is being talked about,
3. Opinion holder: the person, or entity that expresses the opinion.
Market sentiment (also investor attention) is the general prevailing attitude of investors as to anticipated price development in a market. This attitude is the accumulation of a variety of fundamental and technical factors, including price history, economic reports, seasonal factors, and national and world events.
If investors expect upward price movement in the stock market, the sentiment is said to be bullish. On the contrary, if the market sentiment is bearish, most investors expect downward price movement. Market sentiment is usually considered as a contrarian indicator: what most people expect is a good thing to bet against. Market sentiment is believed to be a good predictor of market moves and a good indicator to hedge risk, especially when it is more extreme. Very bearish sentiment is usually followed by the market going up more than normal, and vice versa.
Market sentiment is monitored with a variety of technical and statistical methods such as the number of advancing versus declining stocks and new highs versus new lows comparisons. A large share of the overall movement of an individual stock has been attributed to market sentiment. The stock market's demonstration of the situation is often described as all boats float or sink with the tide, in the popular Wall Street phrase "the trend is your friend". In the last decade, investors are also known to measure market sentiment through the use of news analytics, which include sentiment analysis on textual stories about companies and sectors.
As a forex trader, it is your job to gauge what the market is feeling. We can’t tell the market what we think it should do. But what we can do is react in response to what is happening in the markets.
Note that using the market sentiment approach doesn’t give a precise entry and exit for each trade.
Of course, you can always combine market sentiment analysis with technical and fundamental analysis to come up with better trade ideas. In stocks and options, traders can look at volume traded as an indicator of sentiment.
If a stock price has been rising, but volume is declining, it may signal that the market is overbought.
Or if a declining stock suddenly reversed on high volume, it means the market sentiment may have changed from bearish to bullish. Unfortunately, since the forex market is traded over-the-counter, it doesn’t have a centralized market. This means that the volume of each currency traded cannot be easily measured.
*The information presented above is intended for informative and educational purposes, should not be considered as investment advice, or an offer or solicitation for a transaction in any financial instrument and thus should not be treated as such. Past performance is not a reliable indicator of future results.

Cairo Investment Expo 2021
Ultimate FinTech Awards 2022
European Fintech 2022
2023 Global Forex Awards
Cairo Investment Expo 2021
Ultimate FinTech Awards 2022
European Fintech 2022
2023 Global Forex Awards
Online Chat Chat with us
Email:supportsohomarkets.com
Hak Cipta © 2024 - Semua hak dilindungi undang-undang.
Soho Markets LLC didirikan di St. Vincent & Grenadines sebagai Perusahaan Bisnis Internasional dengan nomor registrasi 1310 LLC 2021.
Peringatan Risiko: CFD adalah instrumen yang kompleks dan memiliki risiko tinggi kehilangan uang dengan cepat akibat leverage. Anda harus mempertimbangkan apakah Anda memahami cara kerja CFD dan apakah Anda mampu mengambil risiko tinggi kehilangan uang Anda. Silakan baca Pengungkapan Risiko selengkapnya.
Pembatasan Regional: SOHO MARKETS GLOBAL LIMITED tidak menyediakan layanan di wilayah Amerika Serikat, Kanada, Israel, Jepang, Korea Utara, Belgia, dan negara-negara yang terkena sanksi PBB/UE.
Soho Markets Global Limited dan Soho Markets LLC tidak menyediakan layanan kepada klien UE. Klien UE hanya dapat dilayani oleh Vstar & Soho Markets Ltd
PERJANJIAN KLIEN (SYARAT DAN KETENTUAN) Kebijakan pribadi Pengungkapan Risiko