Parte del V&S Group
-
TRADING
PLATAFORMA DE NEGOCIACIÓN
- Recursos de negociación
- Servicios institucionales
- Acerca de
Academia de trading en Forex
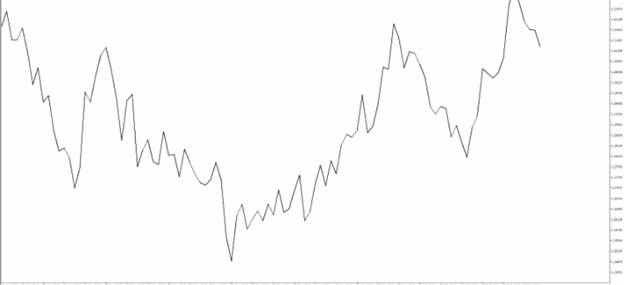
A line chart connects the closing prices of the timeframe you are viewing. So, when viewing a daily chart the line connects the closing price of each trading day. This is the most basic type of chart used by traders. It is mainly used to identify bigger picture trends but does not offer much else unlike some of the other chart types:

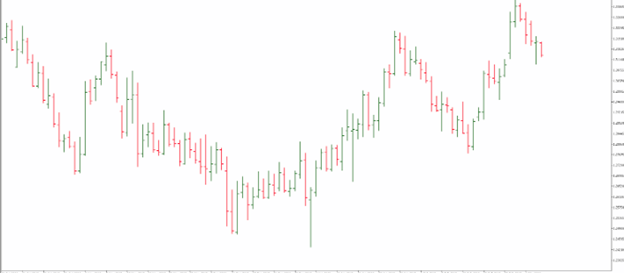
An OHLC bar chart shows a bar for each time period the trader is viewing. So, when looking at a daily chart, each vertical bar represents one day's worth of trading. The bar chart is unique as it offers much more than the line chart such as the open, high, low and close (OHLC) values of the bar.
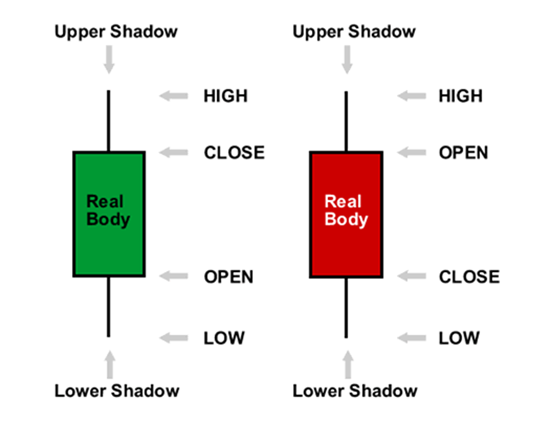
The dash on the left represents the opening price and the dash on the right represents the closing price. The high of the bar is the highest price the market traded during the time period selected. The low of the bar is the lowest price the market traded during the time period selected.
2. The red bars are known as seller bars as the closing price is below the opening price.
In either case, the OHLC bar charts help traders identify who is in control of the market - buyers or sellers. These bars form the basis of the next chart type called candlestick charts which is the most popular type of forex charting:

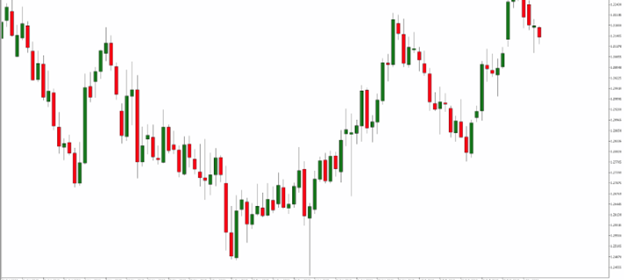
Candlestick charts were first used by Japanese rice traders in the 18th century. They are similar to OHLC bars in the fact they also give the open, high, low and close values of a specific time period. However, candlestick charts have a box between the open and close price values. This is also known as the 'body' of the candlestick.
Many traders find candlestick charts the most visually appealing when viewing live forex charts. They are also very popular as they provide a variety of price action patterns used by traders all over the world.


1. Candlesticks are easy to interpret, and are a good place for beginners to start figuring out forex chart analysis.
2. Candlesticks are easy to use! Your eyes adapt almost immediately to the information in the bar notation.
3. Candlesticks are good at identifying market turning points – reversals from an uptrend to a downtrend or a downtrend to an uptrend.
*The information presented above is intended for informative and educational purposes, should not be considered as investment advice, or an offer or solicitation for a transaction in any financial instrument and thus should not be treated as such. Past performance is not a reliable indicator of future results.

Cairo Investment Expo 2021
Ultimate FinTech Awards 2022
European Fintech 2022
2023 Global Forex Awards
Cairo Investment Expo 2021
Ultimate FinTech Awards 2022
European Fintech 2022
2023 Global Forex Awards
Chat en línea Chatee con nosotros
Correo electrónico:supportsohomarkets.com
Copyright © 2024 - Todos los derechos reservados.
Soho Markets LLC está constituida en San Vicente y las Granadinas como una empresa comercial internacional con número de registro 1310 LLC 2021.
ADVERTENCIA DEL RIESGO: los contratos CFD son instrumentos complejos y comportan un alto riesgo de perder dinero rápidamente debido al apalancamiento. La gran mayoría de las cuentas de inversores minoristas pierden dinero al operar con contratos CFD con este proveedor. Usted debe considerar si comprende cómo funcionan los CFD y si puede permitirse asumir el elevado riesgo de perder dinero.los CFD son instrumentos complejos y conllevan un alto riesgo de perder dinero rápidamente debido al apalancamiento. Debe considerar si comprende cómo funcionan los CFD y si puede permitirse el lujo de correr el alto riesgo de perder su dinero. Lea la Divulgación de riesgos completa.
Restricciones regionales: SOHO MARKETS GLOBAL LIMITED no brinda servicios en los territorios de los Estados Unidos de América, Canadá, Israel, Japón, Corea del Norte, Bélgica y países sancionados por la ONU/UE.
Soho Markets Global Limited y Soho Markets LLC no brindan servicios a clientes de la UE. Los clientes de la UE solo pueden recibir servicios de Vstar & Soho Markets Ltd.
ACUERDO CON EL CLIENTE (TÉRMINOS Y CONDICIONES) Política de Privacidad Aviso sobre Riesgos